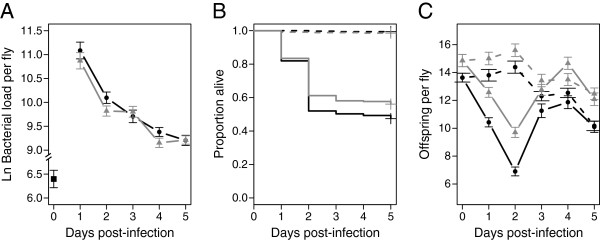
Figure 3.

Diet affects defense. Bacterial load (A), survival (B), and fecundity (C) over five days post-infection across the two diets that vary in glucose concentration (black: high-sugar, 50 g/L; grey: low-sugar, 25 g/L). The dashed lines represent the uninfected CO2 control flies on each diet. Diet significantly affected all three phenotypes measured.
