
Figure 6.
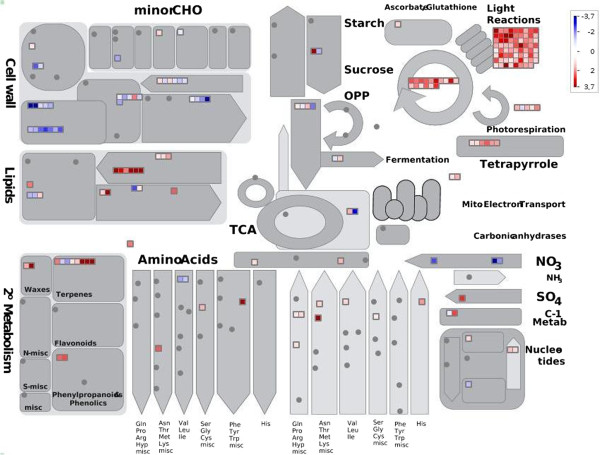
Overview of the effect of mycorrhization-induced expression changes on metabolism of tomato fruits. MapMan software (Metabolism_overview panel) was used to provide a snapshot of modulated genes over the main metabolic pathways. DEGs were binned to MapMan functional categories and Log2 fold changes values are represented. Up-regulated and down-regulated transcripts are shown in red and blue, respectively.