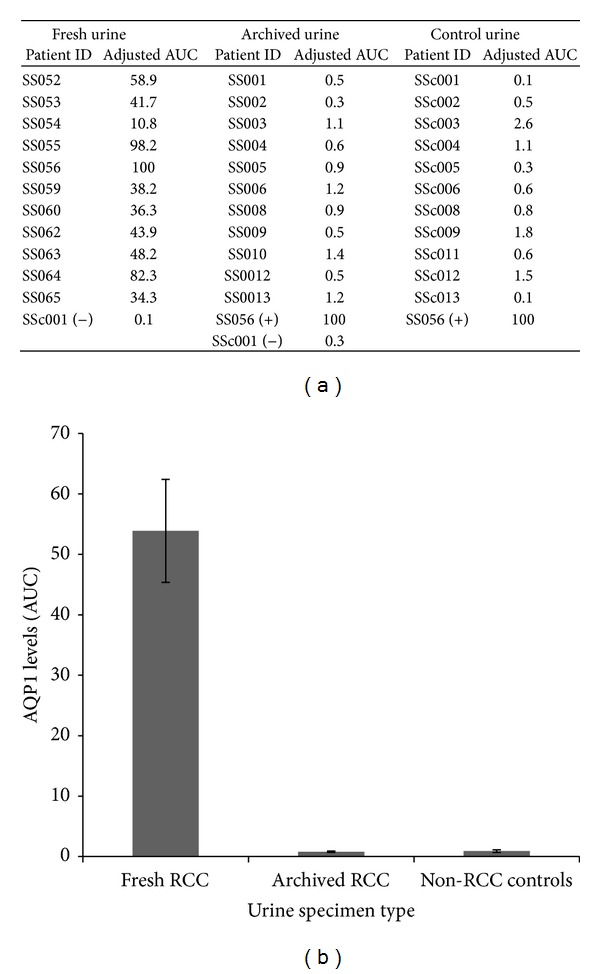
Figure 2.

(a) Table containing arbitrary AUC used to quantify AQP1 levels across all three patients subsets, with each sample normalized to patient SS056. (b) Graphical depiction of the average semiquantitative AQP1 levels in patient fresh urine, archived urine, and volunteer control urine.
