Abstract
We investigate, through first-principles molecular dynamics simulations, the high-pressure melting of BeO in the range 0 ≤ p ≤ 100 GPa. The wurtzite (WZ), zinc blend (ZB), and rocksalt (RS) phases of BeO are considered. It is shown that below 40 GPa, the melting temperature for the WZ phase is higher than that for the ZB and RS phases. When the pressure is beyond 66 GPa, the melting temperature for the RS phase is the highest one, in consistent with the previously reported phase diagram calculated within the quasiharmonic approximation. We find that in the medium pressure range between 40 to 66 GPa, the ZB melting data are very close to those of RS, which results from the fact that the ZB structure first transforms to RS phase before melting. The ZB-RS-liquid phase transitions have been observed directly during the molecular dynamics runs and confirmed using the pair correlation functions analysis. In addition, we propose the melting curve of BeO in the form Tm = 2696.05 (1 + P/24.67)0.42, the zero-pressure value of 2696.05 K falling into the experimental data range of 2693 ~ 2853 K.
Beryllium oxide, BeO, is a unique member of the series of alkaline-earth oxides. Unlike the other members of its class (MgO, CaO, SrO, and BaO) all having the rocksalt structure, BeO crystallizes in the wurtzite structure under ambient conditions, which indicates that Be-O chemical bond is not exclusively ionic but has also some covalent character. It therefore has many anomalous properties, which make it useful in diverse technological applications in ceramics and material industries. For example, thanks to its large direct band gap, it has potential to be used in a variety of nanodevices1,2. Besides, as one member of the hardest materials3, BeO has high thermal conductivity4, low electrical conductivity5, and high melting point6 and hence is a good candidate for use in protective coatings7 and moderator in nuclear reactors8. In particular, the melting point indicates the basic reference points in phase diagrams used in high temperature ceramics. Meanwhile, from the fundamental physics point of view, the study of high-pressure behavior of BeO provides a good understanding of the structural, electronic and dynamic properties and the basic mechanisms that are responsible for these properties.
Motivated by the well-known dielectric theory of Phillips and Van Vechten9,10, the pressure-induced phase transitions have always been the focus of experimental and theoretical studies. Jephcoat et al. did not find any evidence of a phase transition at pressures up to 55 GPa through investigating the Raman spectroscopy of BeO11, while the static x-ray diffraction experiments also showed no phase transitions until the pressure was increased to 137 GPa12. On the theoretical side, there still exists discrepancies in prediction of the transition sequence and transition pressure for BeO. Specifically, two kinds of transition sequences were suggested: wurtzite-zinc blend-rocksalt sequence13,14,15 and wurtzite-rocksalt sequence16,17,18,19. The zinc blende BeO was even reported to be a metastable phase with enthalpy very close to that of the wurtzite phase. It is worth noting that these above-mentioned studies were devoted to material properties at zero temperature, without any thermal effects included. Recently, the description of BeO properties was extended to finite temperatures. Song et al.20 and Zhang et al.21 took into account the effect of lattice vibrations to study the structural stability and phase transformation of BeO based on the mean-field-potential approach. The dispersion relations of BeO were measured by x-ray scattering experiment22 and predicted by density functional perturbation theory23. Wdowik et al.24 and Luo et al.25 calculated the phase diagram and thermal properties of BeO within the quasiharmonic approximation. However, the studied temperature range (<2500 K) was well below the melting temperature at high pressures and the anharmonicity was neglected. It should be noted that the study of high pressure-temperature phase diagram of BeO, especially the high-pressure melting curve, is very important. On the one hand, the melting temperatures of the insulating refractory oxide represent the maximum temperatures for the ceramic to use. On the other hand, the melting curve is an important part of the phase space. For example, the melting curve of MgO, another member of the refractory oxides, has been extensively calculated in a wide pressure range, and thus a full and precise phase diagram was constructed26,27,28. Besides, through investigating the high-pressure melting curves of different phases, some phase transitions at extreme conditions could be determined, with anharmonicity effects included. Whereas, the studies of BeO at high pressure-temperature conditions are still very scarce and even no theoretical melting data was reported. Therefore, a systematic investigation of BeO melting curve and high pressure-temperature phase transitions is desirable.
In this paper, we calculate the melting curve of BeO up to 100 GPa using the Z-method implemented by first-principles molecular dynamics (FPMD) simulations. Three phases of wurtzite, zinc blend and rocksalt are considered. The interesting ZB-RS-liquid phase transitions are discovered. The analysis of structural change along the isochores suggests an intriguing possibility, that is, the existence of a narrow field of ZB stability separating the WZ and RS phases. The fitted zero-pressure melting temperature is 2696.05 K, in agreement with the experimental value of 2693 to 2853 K6.
Results
The static DFT calculations at T = 0 K for a range of volumes are performed first to assess the performance of our method. The total energies as a function of volume for the WZ, ZB, and RS phases of BeO are presented in figure 1. The lines are obtained from the fit with Murnaghan curve. It can be seen that the energy of the WZ phase is slightly lower than that of the ZB phase, in agreement with the experimental and earlier theoretical results. That is because the WZ and ZB phases have the same local tetrahedral bonding and only differ in the second-nearest neighbors. The minima of the total energy locate at the equilibrium volume (per BeO molecule), which are 14.03 Å3 (WZ), 13.92 Å3 (ZB), and 12.17 Å3 (RS), respectively. We also list the calculated lattice parameters, bulk modulus and elastic constants for the three crystal structures of BeO in Table 1, along with the available experimental and other theoretical data for comparison. In the case of the WZ phase, our calculated lattice constants are higher than the experimental data29, while the elastic constant is somewhat lower. However, these results are still relatively close to the experimental value. For the ZB and RS phases, our results agree well with the FPLAPW results21.
Figure 1. The total energies for WZ, RS and ZB phase of BeO as a function of BeO molecule volume.
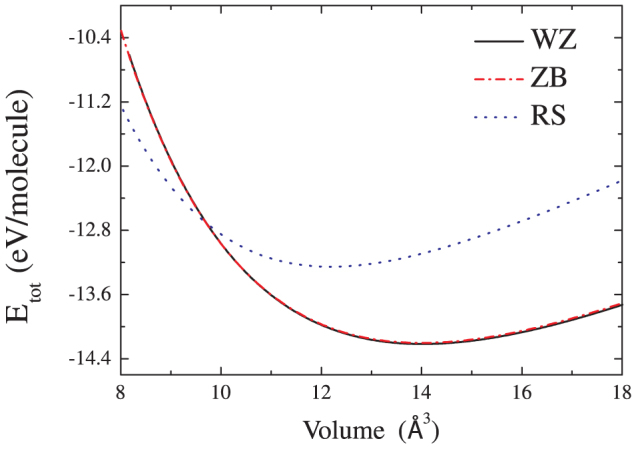
Table 1. Calculated structural parameters for the WZ, ZB and RS phases of BeO, along with the experimental29 and theoretical FPLAPW21 data reported in the literature.
| Phase | Approach | a | c/a | B0 | C11 | C12 | C13 | C33 | C44 |
|---|---|---|---|---|---|---|---|---|---|
| WZ | This work | 2.711 | 1.624 | 207 | 452 | 97 | 72 | 476 | 141 |
| Experiment | 2.698 | 1.622 | 212 | 460 | 125 | 82 | 490 | 145 | |
| FPLAPW | 2.712 | 1.623 | 203 | 432 | 120 | 87 | 463 | 142 | |
| ZB | This work | 3.826 | 207 | 335 | 143 | 215 | |||
| FPLAPW | 3.825 | 201 | 342 | 148 | 208 | ||||
| RS | This work | 3.651 | 240 | 306 | 208 | 299 | |||
| FPLAPW | 3.648 | 231 | 298 | 214 | 294 |
We then perform Z-method simulations for twelve isochores of the WZ, ZB and RS BeO. For every volume, a number of temperatures are adopted, ranging from 6000 to 15000 K with the interval of 100 ~ 500 K. Normally, the isochore line consists of two branches: one is the “solid” branch, which ends at the limit of superheating temperature and the other is the “liquid” branch, which starts at the melting temperature. Most of our calculated isochores form the Z-letter shape, four of which displayed in Fig. 2. The corresponding melting points are pointed out by the arrows. However, the isochores of 12.83 Å3/f.u. and 12.257 Å3/f.u. for the ZB phase present anomalous behavior, as shown in Fig. 3. The initial kinetic energies K are identified aside each points. These two isochores have the similar characteristics. As K increases, the averaged equilibrium temperature and pressure first increase where the initial ZB solid structure probably remains stable. Then when K is further raised to 11000 K and 11300 K for the isochores of 12.83 Å3/f.u. (ZB) and 12.257 Å3/f.u. (ZB) respectively, both of the temperatures and pressures drops. This should be induced by the solid phase transformation, which could be confirmed as a ZB-RS transition by the configurations and pair correlation functions later. The following points with higher K connected by the solid line arrows form the Z curves. That is BeO melts from the new solid structure. The melting points could be easily extracted.
Figure 2. The Z isochores for volumes 14.02 Å3/f.u. (WZ), 12.17 Å3/f.u. (RS), 11.65 Å3/f.u. (RS) and 11.14 Å3/f.u. (RS) (shown by the open squares, circles, uptriangles and diamonds correspondingly).
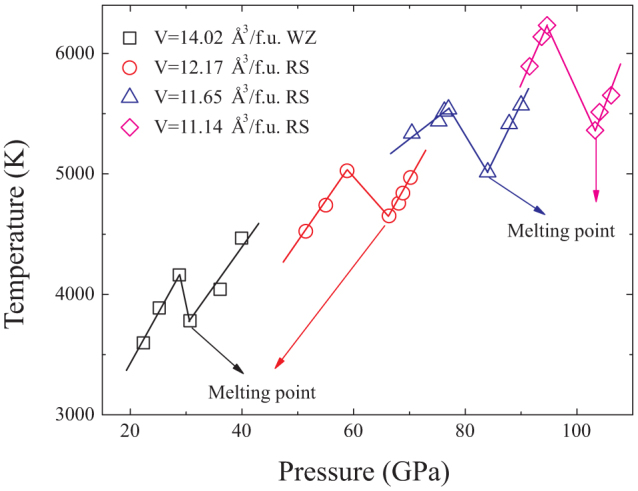
The lines are just for eye.
Figure 3. The isochores of 12.83 Å3/f.u. and 12.257 Å3/f.u. for the ZB phase.
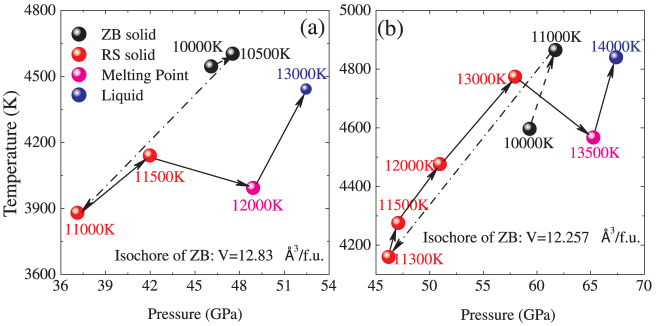
The digits aside each points are the corresponding initial kinetic energies.
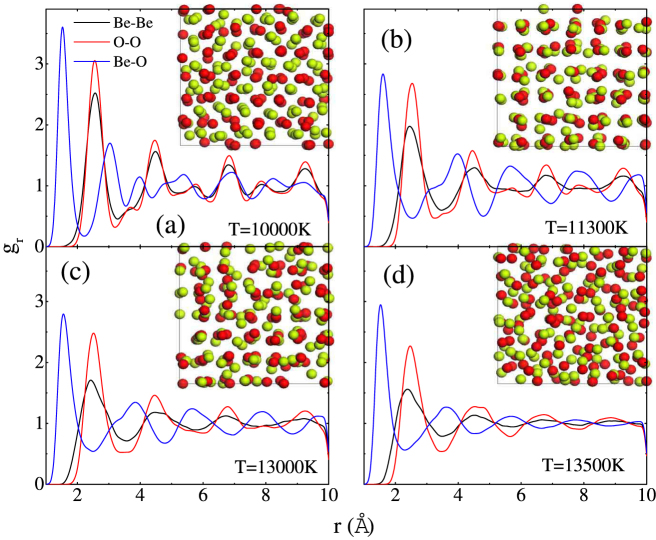
To clarify the structural change in BeO along the isochores of 12.83 Å3/f.u. (ZB) and 12.257 Å3/f.u. (ZB), we calculate the pair correlation functions (PCFs), which give the possibility of finding an atom of a given type at a given distance from a reference atom. Because of the similarity of these two isochores, we just take the isochore of 12.257 Å3/f.u. (ZB) as an example. The PCFs, together with atomic structure along the isochore of 12.257 Å3/f.u. (ZB), are presented in Fig. 4. The atomic structure in Fig. 4(a) could be obviously identified as the ZB structure. Further insight into the PCFs, it is concluded that BeO remains in the ZB solid phase for K of 10000 K. As K increases to 11300 K, both of the atomic structure and PCFs change significantly, but still suggest a solid behavior. For example, the peak structure of gr(Be-O) at 3 Å for 10000 K disappears as shown in Fig. 4(b). The atom structure and PCFs suggest a RS structure. The PCFs for 13000 K presented in Fig. 4(c) are very similar to those for 11300 K, except the peak values, which demonstrates that ZB-RS transition takes place as K is raised to 11300 K and RS structure remains stable for K of 13000 K. Further increase K to 13500 K, BeO transforms into a liquid phase, which is indicated in Fig. 4(d) by the complete disordered atomic structure and significant reduction and broadening of maxima of the PCFs, especially for large values of r. It should be stressed that these molecular dynamics run in NVE ensemble without any intervention. Therefore, it could be concluded that along the isochores of 12.83 Å3/f.u. (ZB) and 12.257 Å3/f.u. (ZB), BeO first transforms from ZB to RS, and then melts into liquid phase, which is responsible for the anomalous characteristics of the isochores. Though we note that the presented ZB solid points along the isochores in Fig. 3 are in the superheating state, there must exist some points with lower K lying in the normal ZB solid state stably. This means ZB solid phase is stable at some lower pressure-temperature conditions, the determination of the specific range depending on the free energy calculations. This conclusion is not totally contrary to the phase transition sequence at zero temperature. As mentioned above, two kinds of zero-temperature transition sequences13,14,15,16,17,18,19 demonstrate that the ZB BeO either doesn't show up or transforms from WZ BeO at high pressures (at least 74 GPa). The presence of lower pressure-temperature ZB BeO should results from the temperature-induced transition from WZ BeO. i.e., the temperature stabilizes the ZB phase over the WZ phase. Here the transition mechanisms can be described in terms of slight modification in the ordering and displacement of Be and O atoms. Though Wdowik et al. have pointed out that the ZB structure is energetically not preferred below 130 GPa and 2500 K24, whether it is thermo-dynamically stable in the region depends on accurate free energy calculations or experiments.
Figure 4. Pair-correlation functions for Be-Be (black), O-O (red) and Be-O (blue) along the isochore of 12.257 Å3/f.u. for the ZB phase.
The atomic structure, where Be and O atoms are denoted by red and green balls, respectively, is also provided in the insets. The corresponding initial kinetic energy is (a) 10000 K; (b) 11300 K; (c) 13000 K; and (d) 13500 K.
The extracted melting points of the WZ, RS and ZB phases are plotted in Fig. 5, along with WZ-RS boundary from Ref. 24. The error bars reflect the standard deviations of the average temperature in our simulations. To our opinion, the largest source of the uncertainty in the calculation of melting point comes from the simulation time not long enough to reach real melting. Size effect turn out to be negligible: the ZB 216-atom and 128-atom results overlap with uncertainties, and the RS 64-atom point lies very close to the 216 atom melting curve, as shown in Fig. 5. It is known that the structure with the higher melting temperature is the more stable phase. Comparison of our WZ, ZB and RS melting points shows that WZ melts at higher temperature below 40 GPa than the other two structure while the melting temperature of RS is the highest above 66 GPa, which means that WZ is stable at low pressures while RS stabilizes at high pressures, in agreement with the quasiharmonic phonon calculations from Wdowik et al.24 qualitatively. In the pressure range between 40 GPa and 66 GPa, the melting temperatures are nearly the same for the RS and ZB phases. Surprisingly, these melting points of ZB just come from the anomalous isochores discussed above. The structural analysis has confirmed that the ZB structure first transforms into the RS phase, and then melts from the RS phase. Therefore, near the melting curve in the medium pressure range, the RS structure is more stable than ZB. Further, we fit our melting data from the isochores of 14.02 Å3/f.u. (WZ), 12.17 Å3/f.u. (RS), 11.65 Å3/f.u. (RS) and 11.14 Å3/f.u.(RS) using Simon equation, and yields BeO melting curve (P in GPa, and Tm in K)
 |
The predicted zero-pressure melting temperature of 2696.05 K is in agreement with the experimental value of 2693 to 2853 K6.
Figure 5. Melting data of BeO, along with WZ-RS boundary from quasiharmonic approximation.
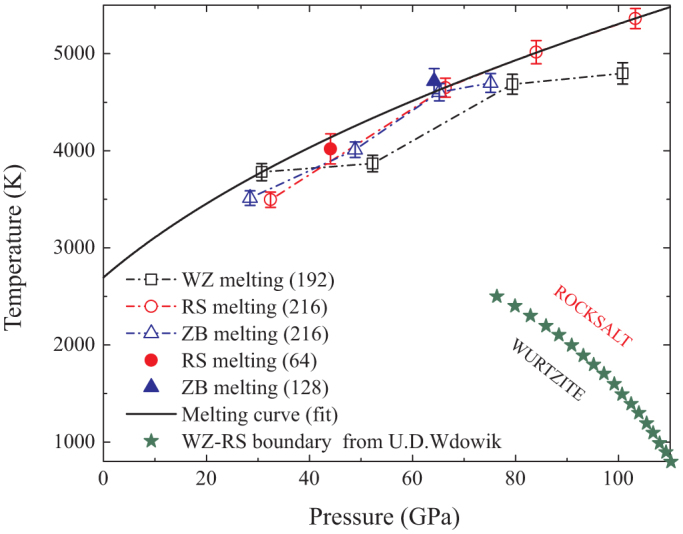
The dash dot line with squares, circles and uptriangles represent the melting conditions for the WZ, RS and ZB phases, respectively. The fitted BeO melting curve is shown as solid thick curve. The stars stand for the WZ-RS boundary in Ref. 24.
Discussion
The high-pressure melting behavior of BeO up to 100 GPa has been studied using the Z-method based on FPMD simulations. We discover that the BeO WZ melting point lies above those of RS and ZB at P < 40 GPa, while for pressure above 40 GPa, BeO melts from the RS phase. It's found that in the medium pressure range between 40 to 66 GPa, the ZB melting points are very close to those of RS. That is because before melting, the ZB phase transforms to RS phase first, which has been observed in molecular dynamics process and confirmed by the structural analysis. It is indicated that there probably exist temperature-induced phase transitions of WZ-ZB-RS. These new findings mean that more interesting phenomena and mechanisms remain to be explored in the high temperature-pressure phase diagram of BeO. In addition, our melting curve provides a reference for the technological applications of BeO. Overall, it has high thermal stability with the melting temperatures higher than about 2700 K and thus is indeed a good candidate for use in coatings, nanodevices, catalysts, and moderator in nuclear reactors.
Methods
The main strategy used here to calculate the melting curve follows the Z-method, which is proposed by Belonoshko et al.30. The idea is to perform FPMD simulations in the microscopic ensemble (NVE) on a single solid system at different initial kinetic energies (K). A realistic limit of superheating can be reached without any external intervention on the dynamics of the melting process. On further increasing K slightly, the temperature will drop naturally to the melting temperature as the latent heat is removed from the kinetic energy. The connected P-T points on the isochore form a characteristic shape similar to the letter Z. The Z method is a good alternative to the two-phase method or the coexistence method because it allows one to derive melting temperatures in close agreement with the two-phase method but with a comparatively modest computational effort. It has been proven successful to predict the melting temperatures in several systems, such as Al31, H32, MgO27, Pt33, and even the anomalous melting behavior of Li34. In addition, a comparably large number of atoms and long runs are still needed to achieve complete melting of the system.
We perform the Z-method simulations of BeO melting with Vienna ab initio simulation package (VASP) for WZ (for four volumes, 14.02 Å3/f.u., 12.68 Å3/f.u., 11.76 Å3/f.u. and 11.08 Å3/f.u., where f.u. denotes a formula unit of BeO), ZB (for four volumes, 14.00 Å3/f.u., 12.83 Å3/f.u., 12.257 Å3/f.u. and 11.89 Å3/f.u.), and RS (for four volumes, 13.18 Å3/f.u., 12.17 Å3/f.u., 11.65 Å3/f.u. and 11.14 Å3/f.u.). The calculations are based on density functional theory (DFT) in the finite-temperature formulation due to Mermin. The all-electron projector augmented wave (PAW) method is adopted, with the exchange-correlation potential treated as Perdew-Burke-Ernzerhof (PBE) formalism, as implemented in the VASP code. We fix the plane-wave cut-off at 400 eV. The Brillouin zone is sampled with Γ–point for molecular dynamics. For each density, integration of the equations of motion proceeds with a time step of 0.3–1.0 fs for different pressure-temperature ranges and the energy drift with such a small time step is negligible. In each of the simulations, the time scale lies between 10 and 20 ps. The computational cells are constructed with 196, 216 and 216 atoms for WZ, ZB and RS structure, respectively. Additional convergence tests for the particle number are performed, which includes (i) Z-method melting simulations with 128-atom ZB supercell at 12.257 Å3/f.u.; (ii) Z-method melting simulations with 64-atoms RS supercell at 13.18 Å3/f.u.
The zero-temperature energy calculations are performed by means of the linear tetrahedron method with Blöchl's correction35, while relaxation procedures and force calculations are carried out according to the Methfessel-Paxton scheme36. The plane-wave cut-off is fixed at 1250 eV, and the Brillouin zone is sampled using a 15 × 15 × 8 and 16 × 16 × 16 Monkhorst net for integration in the reciprocal space. The total energies are converged to within 0.5 meV/atom.
Author Contributions
D.F.L. did the calculations. P.Z., J.Y. and D.F.L. analyzed the results and wrote the paper. P.Z. and J.Y. were responsible for project planning and execution.
Acknowledgments
This work was supported by National Magnetic Confinement Fusion Science Program of China under Grant 2012GB1066001, NSFC under Grants No. 11205019, No. 11004012 and No. 11275032, by the National Fundamental Security Research Program of China, and by the Foundations for Development of Science and Technology of China Academy of Engineering Physics under Grant No. 2011A0102007 and 2012B0102012.
References
- Sorokin P. B., Fedorov A. S. & Chernozatonskiǐ L. A. Structure and properties of BeO nanotubes. Phys. Solid State 48, 398–401 (2006). [Google Scholar]
- Baumeier B., Krüger P. & Pollmann J. Structural, elastic, and electronic properties of SiC, BN, and BeO nanotubes. Phys. Rev. B 76, 085407 (2007). [Google Scholar]
- Hazen R. M. & Finger L. W. High-pressure and high-temperature crystal chemistry of beryllium oxide. J. Appl. Phys. 59, 3728–3733 (1986). [Google Scholar]
- Slack G. A. & Austerman S. B. Thermal conductivity of BeO single crystals. J. Appl. Phys. 42, 4713–4717 (1971). [Google Scholar]
- Roessler D. M., Walker W. C. & Loh E. Electronic spectrum of crystalline beryllium oxide. J. Phys. Chem. Solids 30, 157–167 (1969). [Google Scholar]
- Hlaváč J. Melting temperatures of refractory oxides: Part I. Pure Appl. Chem. 54, 682–688 (1982). [Google Scholar]
- Duman S., Sütlü A., Bagcl S., Tütüncü H. M. & Srivastava G. P. Structural, elastic, electronic, and phonon properties of zinc-blende and wurtzite BeO. J. Appl. Phys. 105, 033719 (2009). [Google Scholar]
- Loh E. Optical phonons in BeO crystals. Phys. Rev. 166, 673–678 (1968). [Google Scholar]
- Phillips J. C. Bonds and Bands in Semiconductors, (Academic, New York, 1973). [Google Scholar]
- Phillips J. C. Ionicity of chemical bond in crystals. Rev. Mod. Phys. 42, 317–356 (1970). [Google Scholar]
- Jephcoat A. P., Hemley R. J., Mao H. K., Cohen R. E. & Mehl M. J. Raman spectroscopy and theoretical modeling of BeO at high pressure. Phys. Rev. B 37, 4727–4734 (1988). [DOI] [PubMed] [Google Scholar]
- Mori Y., Ikai T. & Takarabe K. Photon Factory Activity Report. Part B: High pressure science. 20, 215 (2003).
- Van Camp P. E. & Van Doren V. E. Ground-state properties and structural phase transformation of beryllium oxide. J. Phys. Condens. Matter 8, 3385–3390 (1996). [Google Scholar]
- Boettger J. C. & Wills J. M. Theoretical structural phase stability of BeO to 1 TPa. Phys. Rev. B 54, 8965–8968 (1996). [DOI] [PubMed] [Google Scholar]
- Park C. J., Lee S. G., Ko Y. J. & Chang K. J. Theoretical study of the structural phase transformation of BeO under pressure. Phys. Rev. B 59, 13501–13504 (1999). [Google Scholar]
- Cai Y., Wu S., Xu R. & Yu J. Pressure-induced phase transition and its atomistic mechanism in BeO: a theoretical calculation. Phys. Rev. B 73, 184104 (2006). [Google Scholar]
- Amrani B., Hassan F. E. H. & Akbarzadeh H. First-principles investigations of the ground-state and excited-state properties of BeO polymorphs. J. Phys. Condens. Matter 19, 436216 (2007). [Google Scholar]
- Yu B. R., Yang J. W., Guo H. Z., Ji G. F. & Chen X. R. Phase transition and elastic properties of BeO under pressure from first-principles calculations. Physica B 404, 1940–1946 (2009). [Google Scholar]
- Sahariah M. B. & Ghosh S. Dynamical stability and phase transition of BeO under pressure. J. Appl. Phys. 107, 083520 (2010). [Google Scholar]
- Song H. F., Liu H. F. & Tian E. Structural and thermodynamic propertis of hexagonal BeO at high pressures and temperatures. J. Phys. Condens. Matter 19, 456209 (2007). [Google Scholar]
- Zhang Q. L., Zhang P., Song H. F. & Liu H. F. Mean-field potential calculations of high-pressure equation of state for BeO. Chin. Phys. B 17, 1341–1348 (2008). [Google Scholar]
- Bosak A., Schmalzl K., Krisch M., van Beek W. & Kolobanov V. Lattice dynamics of beryllium oxide: inelastic x-ray scattering and ab initio calculations. Phys. Rev. B 77, 224303 (2008). [Google Scholar]
- Sahariah M. B. & Ghosh S. Ab initio calculation of lattice dynamics in BeO. J. Phys. Condens. Matter 20, 395201 (2008). [DOI] [PubMed] [Google Scholar]
- Wdowik U. D. Structural stability and thermal properties of BeO from the quasiharmonic approximation. J. Phys. Condens. Matter 22, 045404 (2010). [DOI] [PubMed] [Google Scholar]
- Luo F., Cheng Y., Cai L. C. & Chen X. R. Structure and thermodynamic properties of BeO: Empirical corrections in the quasiharmonic approximation. J. Appl. Phys. 113, 033517 (2013). [Google Scholar]
- Alfé D. Melting curve of MgO from first-principles simulations. Phys. Rev. Lett. 94, 235701 (2005). [DOI] [PubMed] [Google Scholar]
- Belonoshko A. B., Arapan S., Martonak R. & Rosengren A. MgO phase diagram from first principles in a wide pressure-temperature range. Phys. Rev. B 81, 054110 (2010). [Google Scholar]
- Boates B. & Bonev S. A. Demixing instability in dense molten MgSiO3 and the phase diagram of MgO. Phys. Rev. Lett. 110, 135504 (2013). [DOI] [PubMed] [Google Scholar]
- Sirota N. N., Kuzmina A. M. & Orlova N. S. Elastic-moduli of beryllium-oxide at 10–720 K, from the X-ray data. Dokl. Akad. Nauk SSSR 314, 856–862 (1990). [Google Scholar]
- Belonoshko A. B., Skorodumova N. V., Rosengren A. & Johansson B. Melting and critical superheating. Phys. Rev. B 73, 012201 (2006). [Google Scholar]
- Bouchet J., Bottin F., Jomard G. & Zérah G. Melting curve of aluminum up to 300 GPa obtained through ab initio molecular dynamics simulations. Phys. Rev. B 80, 094102 (2009). [Google Scholar]
- Davis S. M., Belonoshko A. B. & Johansson B. High-pressure melting curve of hydrogen. J. Chem. Phys. 129, 194508 (2008). [DOI] [PubMed] [Google Scholar]
- Belonoshko A. B. & Rosengren A. High-pressure melting curve of platinum from ab initio Z method. Phys. Rev. B 85, 174104 (2012). [Google Scholar]
- Li D. F., Zhang P., Yan J. & Liu H. Y. Melting curve of lithium from quantum molecular-dynamics simulations. EuroPhys. Lett. 95, 56004 (2011). [Google Scholar]
- Blöchl P. E., Jepsen O. & Andersen O. K. Improved tetrahedron method for Brillouin-zone integrations. Phys. Rev. B 49, 16223 (1994). [DOI] [PubMed] [Google Scholar]
- Methfessel M. & Paxton A. T. High-precision sampling for Brillouin-zone integration in metals. Phys. Rev. B 40, 3616 (1989). [DOI] [PubMed] [Google Scholar]


