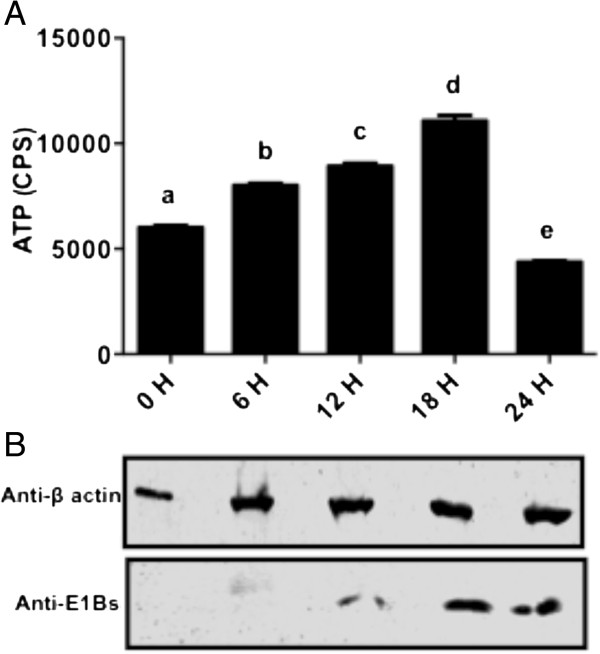
Figure 2.
ATP production in BAdV-3 infected cells. (A) Data represents the mean of 2 independent experiments, each with 3 replicates. Means with the different letter are significantly different. * P < 0.0001 (B) Western blot analysis of BAdV-3 infected cells using anti-β-actin serum (Sigma, Mississauga, ON, Canada) or anti -E1aBs serum [31].

