
Figure 4.
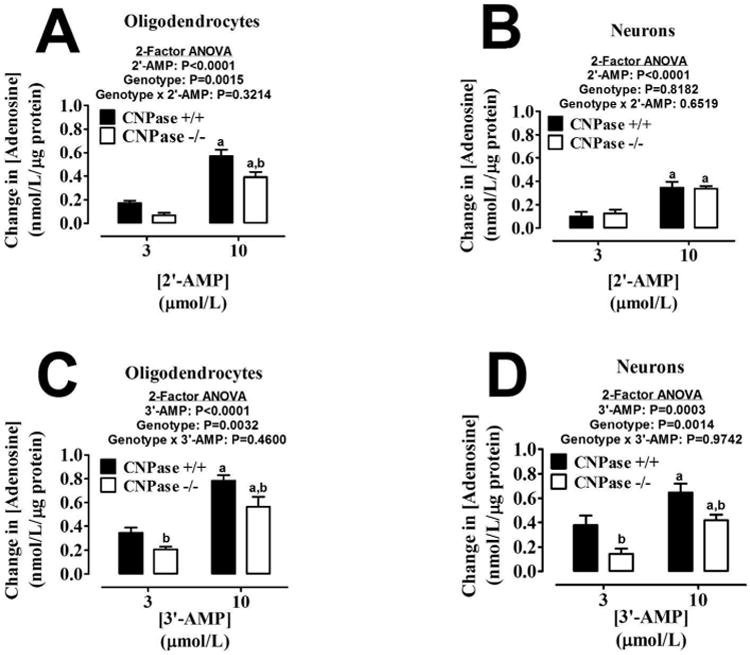
Bar graphs depict the production of extracellular adenosine from extracellular 2′-AMP (A and B) and extracellular 3′-AMP (C and D) in oligodendrocytes (A and C) and neurons (B and D) from CNPase +/+ and CNPase -/- mice. “a” indicates significance difference from corresponding 3 μmol/L concentration of 2′,3′-cAMP; and “b” indicates significant difference between genotypes at the same concentration of 2′,3′-cAMP. Significance is defined as P<0.05. Values represent means ± SEM for 6 experiments.