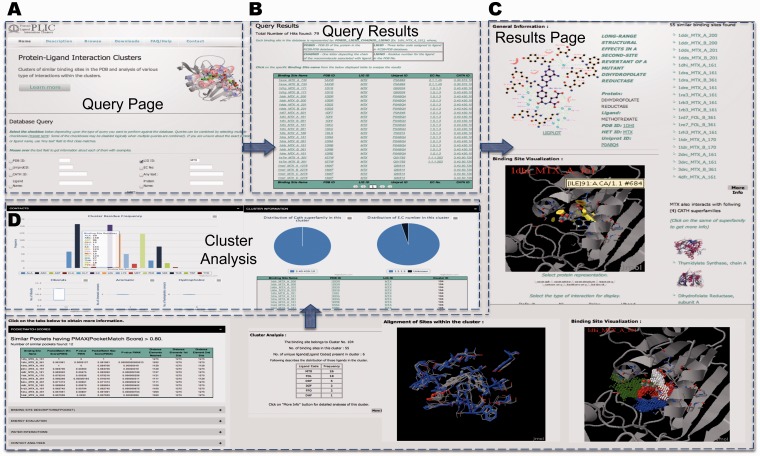
Figure 4.
PLIC database server. (A) Snapshot of the query page for the PLIC database. (B) The page displaying the results of the query in the tabular form containing information about the name of the binding site, protein, ligand, UniprotID, EC number and CATH superfamily ID. (C) The results page displayed after a specific binding site name is clicked. The results page consists of Jmol plug-in for visualization of interactions, clusters indicating high-energy interaction zones for different probes, alignment of binding sites within the cluster, similar sites with PocketMatch scores, cluster information and various attributes associated with the interaction. (D) Barplot illustrating the distribution of various residues within the binding site environment of the cluster and box plots indicating the variations observed in different attributes of interactions within the cluster are displayed on the cluster analysis page.

