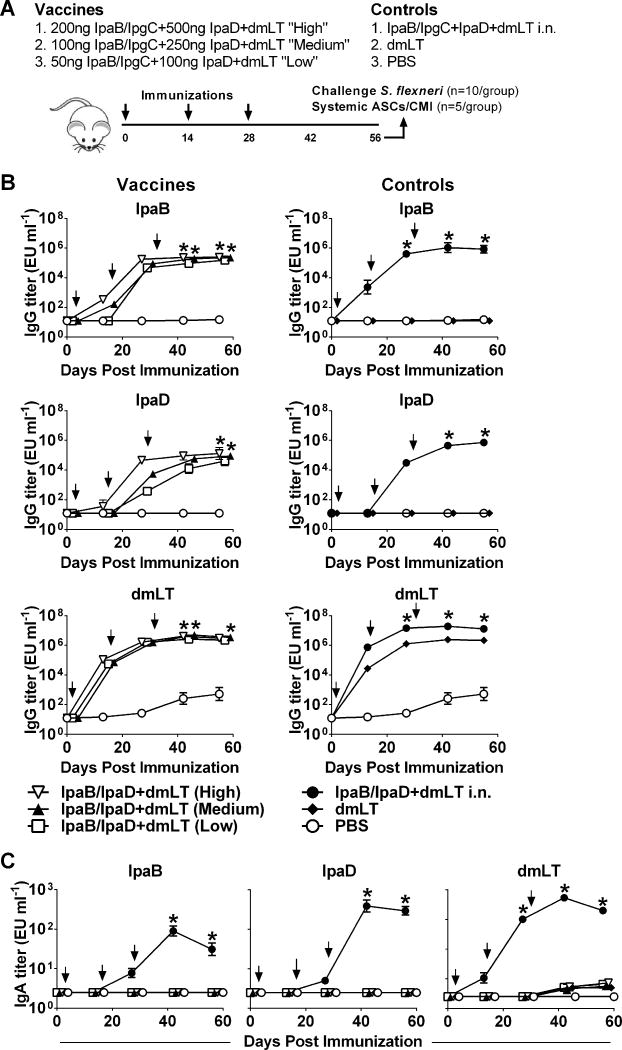
Figure 4.
Serum IgG and fecal IgA responses to vaccine Ag. (A) Mice were immunized i.d. on days 0, 14 and 28 (arrows) with increasing dosage levels of IpaB with IpgC chaperone (IpaB/IpgC) and IpaD, admixed with dmLT. Control groups received IpaB/IpgC, IpaD and dmLT i.n., dmLT alone or PBS. IpaB-, IpaD- and dmLT-specific serum IgG (B) and stool IgA (C). Data represent mean titers ±SEM from 10 individual mice per group. Arrows indicate immunization. Asterisks denote statistically significant differences comparing vaccinated mice versus PBS control, where p< 0.05.

