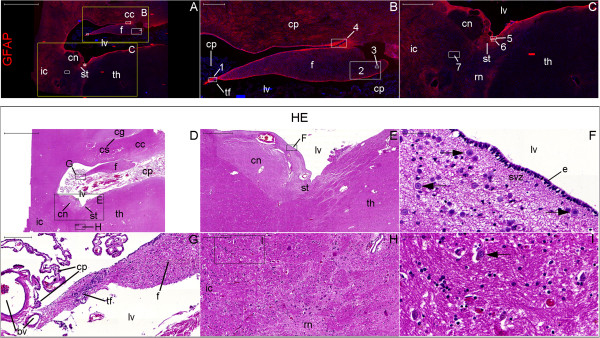
Figure 23.

Cytoarchitecture landmarks surrounding the lateral ventricle in the coronal plane. This panel displays left hemisphere sections analyzed by GFAP (red) (A–C) and hematoxylin-eosin (HE) staining (D–I). Boxes identified by upper cases represent the locations of the respective figures in this panel; boxes identified by numbers show the locations analyzed in Figures 24 and 25. Note the cluster of corpora amylacea (arrows in (F)) in the subventricular zone (svz). Likewise, note the lateral boundaries of the reticular nucleus (rn) of the thalamus (th) identified by the presence of neurons (arrow in (I)) medial to the internal capsule (ic). (bv), blood vessel; (cc), corpus callosum; (cg), cingulate gyrus; (cn), body of the caudate nucleus; (cp), choroid plexus; (cs), callosal sulcus; (e), ependymal cell layer; (lv), body of the lateral ventricle; (f), fornix; (st), stria terminalis; (tf), taenia fornicis. Scale bars: (A), (D) = 5,000 μm; (B), (E) = 1,000; (C) = 2,000 μm; (F), (I) = 50 μm; (G), (H) = 200 μm.
