
Figure 24.
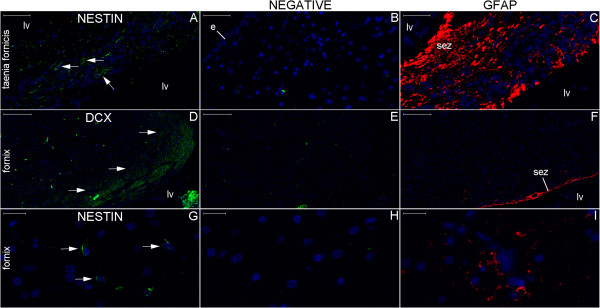
Single staining of neurogenesis markers surrounding the body of the lateral ventricle. The locations studied in (A–C), (D–F) and (G–I) represent the boxes numbered 1 to 3, respectively, in Figure 23. The number of NPCs is higher in the taenia fornicis (arrows in (A)) than in the fornix (arrows in (G)). DCX expression occurs in the fornix near the subependymal zone (sez) at the boundaries of the corpus callosum (arrows in (D)). GFAP expression is high in the taenia fornicis and in the anuclear gap underneath the ependymal cell layer (e) of the lateral ventricle (lv) wall ((C) and (F)). Scale bars: (A–C) = 50 μm; (D–F) = 200 μm; (G–I) = 20 μm.