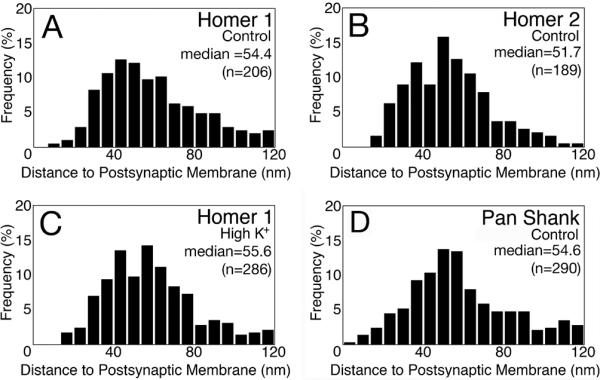
Fig. 6. Histograms of vertical distribution of Homer and Shank at the PSD.

The distances of labels to the postsynaptic membrane were plotted as histograms. Under control conditions, the vertical distribution within the PSD complex is similar for Homer 1 (A), Homer 2 (B), and pan Shank (D). Upon high K+ depolarization, the distribution of Homer 1 did not change within the PSD complex (C). Statistical analysis was carried out with Kruskal-Wallis rank sum test (KaleidaGraph, Synergy Software, Reading, PA) with significance level set at P<0.05. None of the histograms was significantly different from each other.
