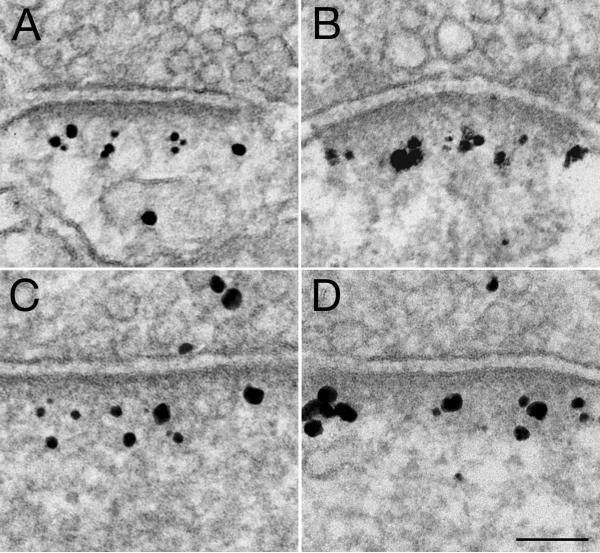
Fig. 7. Distribution of Homer 1 at PSDs does not change after acute synaptic activity.
Intensity of label for Homer 1 at PSDs of mouse cerebral cortex did not appear to change after fast (A) and delayed (B) perfusion fixation. Similarly, in dissociated hippocampal cultures, label for Homer 1 within the PSD complex are the same in the control (C) vs. NMDA treatment (50 μM for 2 min; D; quantified in Fig. 8). PSDs have a thicker appearance after stimulation (B, cf. Tao-Cheng et al., 2007; D, cf. Dosemeci et al., 2001). Scale bar = 0.1 μm

