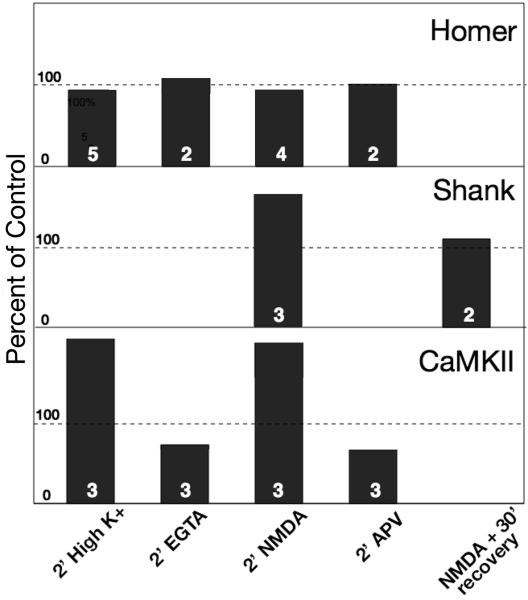
Fig. 8. Amount of label for Homer 1, pan Shank and CaMKII at the PSD complex under different experimental conditions.
Values are normalized to control for each experiment. Number of experiments is indicated at the bottom of each bar. Statistical analysis was carried out with ANOVA (Tukey post test) within each experiment. For Homer 1, not significantly different from control among all cases in all experiments (even at P<0.1). For Shank, control vs. NMDA is significant (P<0.005), as is NMDA vs. recovery (P<0.001). For CaMKII, control vs. high K+ or NMDA are significant (P<0.0001); control vs. EGTA or APV, significant in 2 out of 3 experiments (P< 0.05, 1 exp; P< 0.1, 1 exp).

