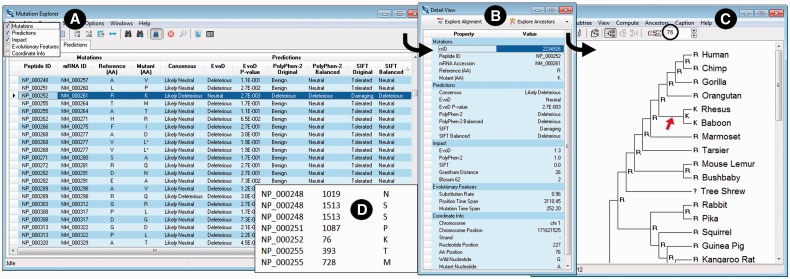
Fig. 2.
Example screenshots displaying results. (A) Mutation Explorer with the Predictions tab selected and diagnoses for many variants displayed; (B) Detail View showing all prediction data for the variant, which is selected on the Prediction Data tab of the Mutation Explorer; (C) Tree Explorer showing the ancestral states in the 46-species reference tree at the amino acid position (position 76 in the example shown) of the variant being investigated; and (D) an example of variants specified in a text file, which can be analyzed en mass in MEGA-MD for high-throughput analysis

