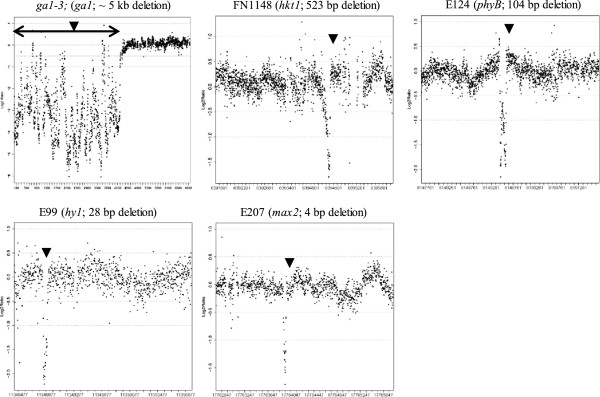
Figure 3.

Visualization of five genomic deletions of varying size in Arabidopsis mutant lines ga1-3, FN1148, E124, E99 and E207 (gene affected in each mutant and deletion sizes are shown). Scatter plots show the relative log2 DNA hybridization intensities (mutant minus control) representing genes at 6 bp (GA1 and HKT1) or 2 bp (PHYB, HY1 and MAX2, see Additional file 1: Figure S5–8) probe spacing. Black dots represent probes and the black triangle indicates the location of the deletion within the region that the custom array probes represent. An obvious ‘deletion signal’ (contiguous points with relatively extreme negative log2 ratio values) was detected in all lines.
