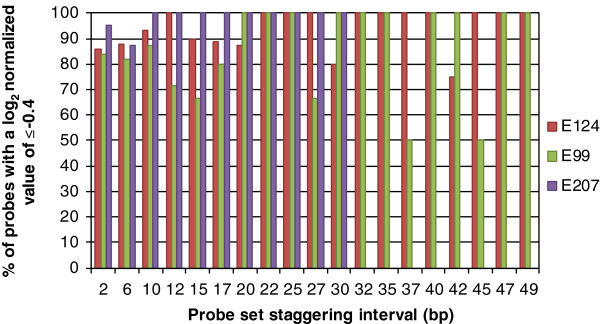
Figure 6.

A histogram showing the percentage of ‘designed’ probes that indicated a genomic deletion. The columns represent the percent of total probes that covered each of the deleted regions in lines E124 (104 bp AtPHYB genic mutation), E99 (28 bp AtHY1 genic mutation) and E207 (4 bp AtMAX2 genic mutation) that were detected as deletions. The probes that were categorized as deletion probes had normalized hybridization signal log2 ratios (mutant versus control) of ≤ −0.4.
