
Figure 1.
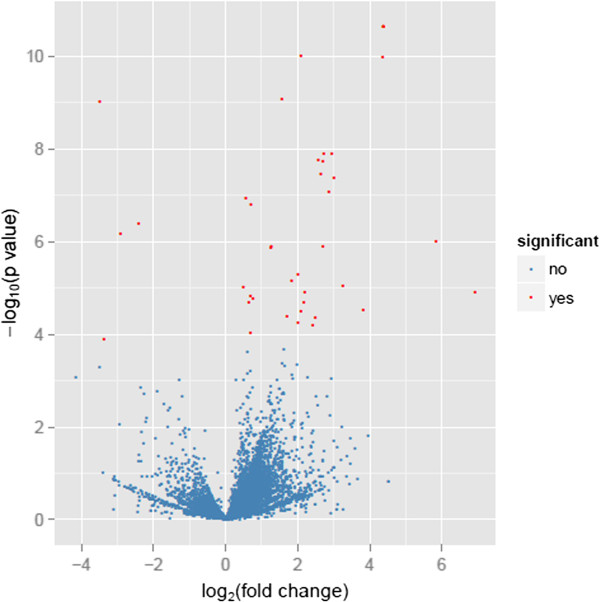
Volcano plot displaying differential expressed genes between the mammary glands of two cows with high milk PP and FP and two cows with low PP and FP. The y-axis corresponds to the mean expression value of log10 (p-value), and the x-axis displays the log2 fold change value. The red dots represent the significantly differentially expressed transcripts (p < 0.05, false discovery rate (FDR) q < 0.05) between two cows with high milk PP and FP and two cows with low PP and FP; the blue dots represent the transcripts whose expression levels did not reach statistical significance (p > 0.05, FDR q > 0.05) between the high and low groups.