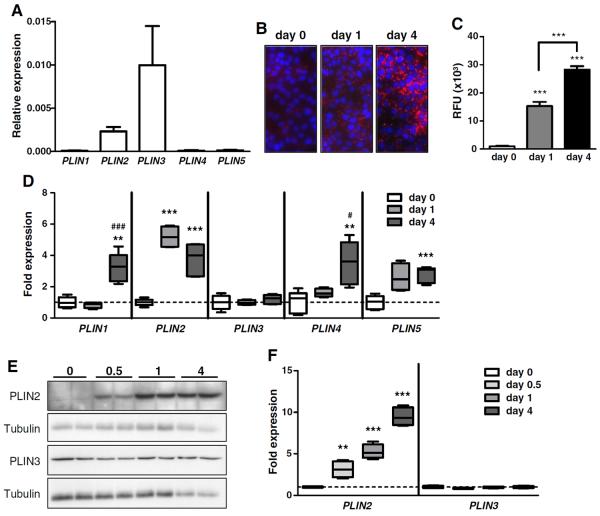
Fig. 1.
Abundance and regulation of perilipin members in SZ95 sebocytes. A, Analysis of perilipin transcript levels by quantitative RT-PCR in undifferentiated cells (n = 5 samples/group). B, Images of DAPI and Nile Red-stained SZ95 sebocytes before (day 0) and at days 1 and 4 after the addition of LA to the culture medium. C, Measurement of the emitted fluorescence of cells shown in B (n = 8 replicates/time point). D, Expression of perilipins at days 1 and 4 of LA-induced differentiation relative to undifferentiated cells (day 0). N = 5 replicates/group. E, Western blot analysis of PLIN2 and PLIN3 in undifferentiated cells (day 0) and at days 0.5, 1, and 4 after the induction of differentiation. The blots were stripped and employed for the detection of tubulin as a loading control. F, Quantification of PLIN2 and PLIN3 protein levels during the differentiation of SZ95 cells by densitometric analysis (n = 4 replicates/time point). Data were analyzed by Student's t-test. Asterisks indicate significant differences between day 1 or day 4 and undifferentiated cells (*p < 0.05, ** p < 0.01, *** p < 0.001). In D, # indicates significant differences between day 1 and day 4.

