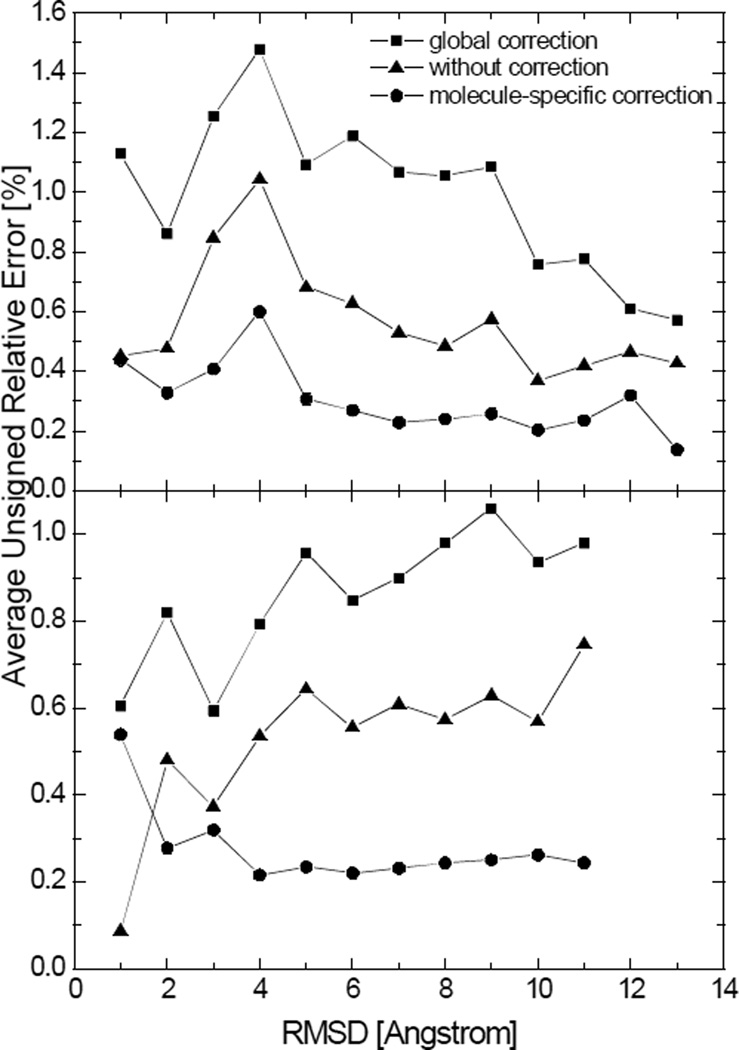
Figure 10.
Average unsigned relative errors in the numerical SAS areas after the global correction, without correction, and after molecule-specific corrections versus the backbone RMSD for two tested peptides. Each data point represents the average unsigned relative error in the numerical surface areas for structures with the backbone RMSD within a range of 1Å with respect to the crystal structure. Top: hairpin; Bottom: helix. (grid spacing: 1/2Å)

