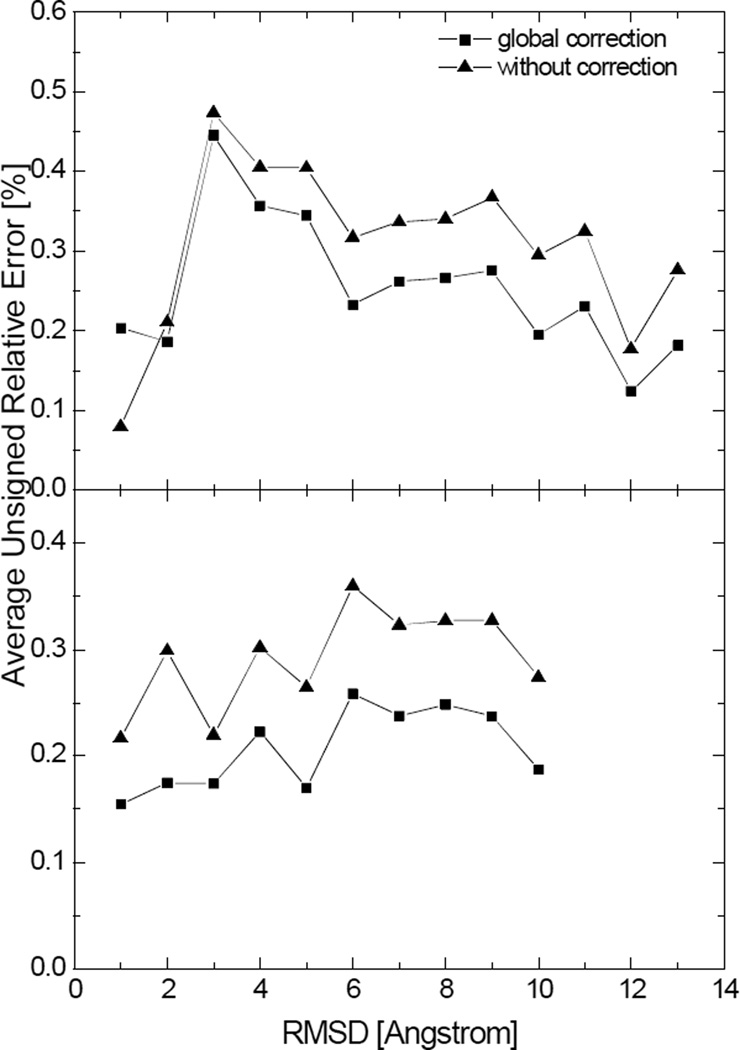
Figure 9.
Average unsigned relative errors in the numerical SES areas after the global correction and without correction versus the backbone root-mean-square deviation (RMSD) for two tested peptides. Each data point represents the average unsigned relative error in the numerical surface areas for structures with the backbone RMSD within a range of 1Å with respect to the crystal structure. Top: hairpin; Bottom: helix. (grid spacing: 1/2Å)

