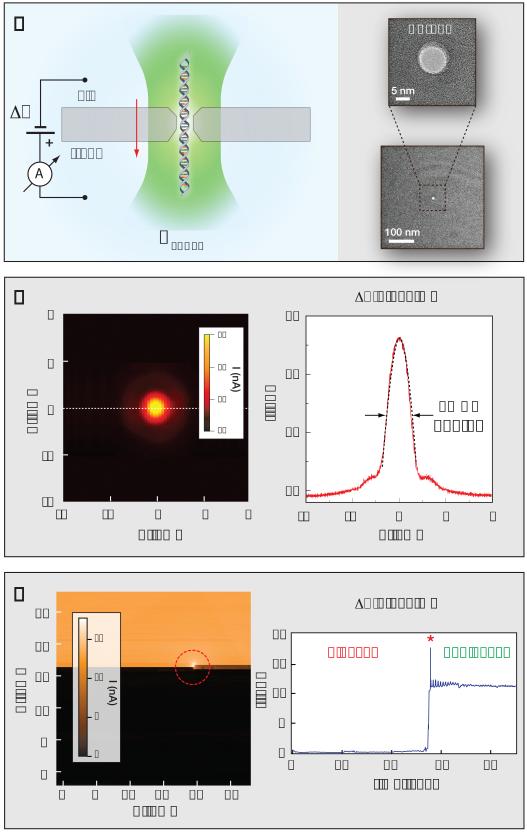
Figure 1. The photo-conductive effect in solid-state nanopores.
a) Cartoon illustrating the optical nanopore setup. A solid state nanopore is positioned at a laser beam focus by a nano-positioner, and the ion-current flowing through the pore is measured before and during translocation of DNA molecules. The inset shows a high-resolution Transmission Electron Micrographs of a typical pore (10 nm). b) Left: surface plot showing nanopore ionic current enhancement as a 10 mW focused laser beam (λ = 532 nm) scans the 4 × 4 μm2 SiN membrane at 1 μm/s. When the focused beam reaches the nanopore it produces a significant increase in measured current (2.4-fold increase for this pore). Right: line profile through Y=0, fitted using a Gaussian function with FWHM of ~500 nm, consistent with the diffraction limit. c) Clearing a blocked solid-state nanopore with light. Left: a 5 mW laser intensity raster scan of the entire SiN window (30 × 30 μm2, lower left to top right). The color map represents the current flowing through the pore at ΔV = 300 mV. As soon as the laser beam overlaps with the nanopore location, it clears the pore and thereafter the ionic current stabilizes at the open pore level of 12 nA. Right: time trace of I during the laser scan.

