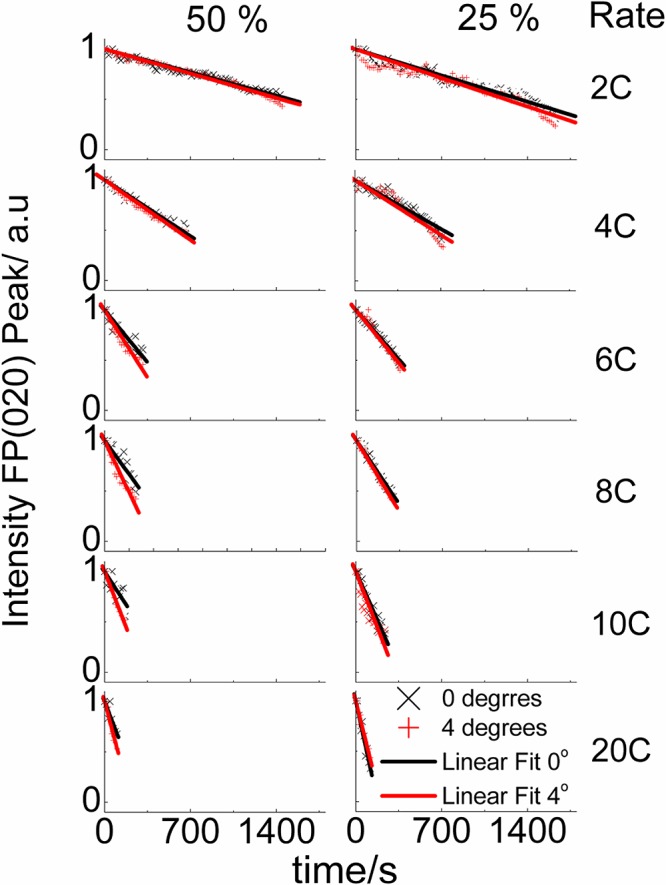
Figure 6.

The variation in FePO4 phase fraction expressed as the FePO4 020 peak height (relative to the combined heights of the FePO4 020 and the LiFePO4 020 + 211) with time during cell discharge for electrodes prepared with 50% and 25% LiFePO4 and linear fits to the data.
