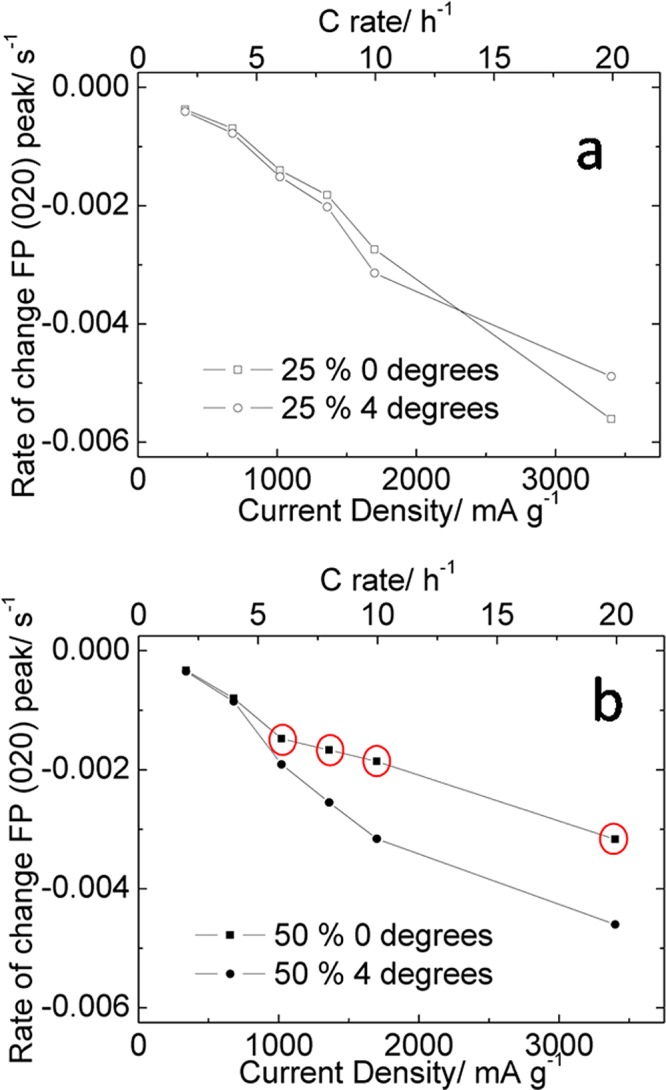
Figure 7.

The rate of change of the intensity of the FePO4 020 reflection during discharge as a function of current density and C rate for (a) 25% and (b) 50% LiFePO4-containing electrodes. Data were extracted from the linear fits shown in Figure 6. Points circled in red highlight those which indicate significant concentration gradients within the electrode.
