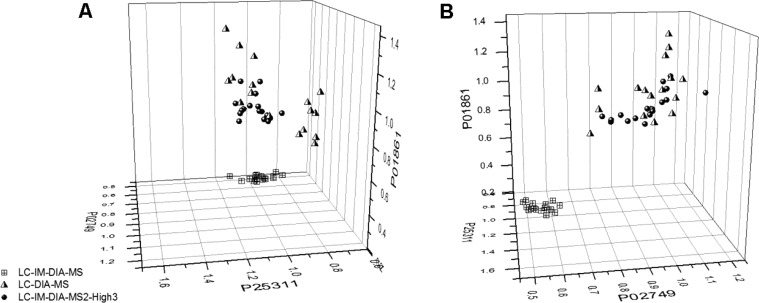
Figure 4.
Two views of a 3D scatter plot of normalized protein quantities showing differential quantitation between analysis methods. Normalized values for LC-IM-DIA-MS (squares), LC-DIA-MS (triangles), and LC-IM-DIA-MS2 (circles) were plotted on axes of high (Ig γ-4 chain C region, P01861), medium (β-2-glycoprotein 1, P02749), and low (zinc-α-2-glycoprotein, P25311) abundance proteins.

