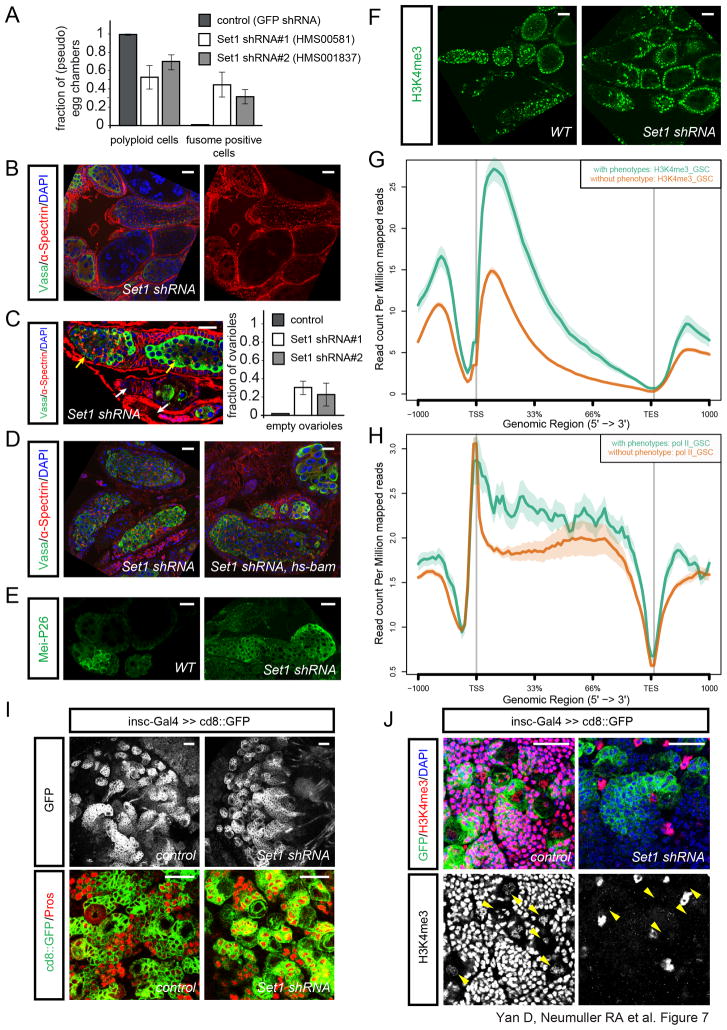
Figure 7. Set1 regulates GSC but not Nb self-renewal.
(A) Quantification of the Set1 loss of function phenotype in the germline by MTD-Gal4 (bars represent the mean+/− S.D. of the observed frequencies (n=175 pseudo egg chambers (HMS00581), n=105 pseudo egg chmbers (HMS001837)).
(B) Ovaries expressing Set1 shRNA (HMS00581) by MTD-Gal4 are labeled by α-Spectrin, Vasa and DAPI staining.
(C) Co-occurrence of pseudo egg chambers filled with undifferentiated fusome containing cells (yellow arrows) and empty ovarioles (white arrows) in MTD/Set1 shRNA ovaries. Quantification of the empty ovariole phenotype (bars represent the mean+/− S.D. of the observed frequencies (n=74 ovarioles (HMS00581), n=55 ovarioles (HMS001837)).
(D) Overexpressing bam using hs-bam fails to fully rescue the differentiation defects in Set1 shRNA/nanos-Gal4 background, as shown by α-Spectrin, Vasa and DAPI staining.
(E) Mei-P26 antibody staining in WT and Set1 shRNA/MTD-Gal4 ovaries.
(F) H3K4me3 staining in WT and Set1 shRNA/MTD-Gal4 ovaries.
(G) H3K4me3 ChIP from FACS purified GSCs showing increased levels of lysine4 tri-methylation at genes with a phenotype (green) in our screen over genes without a detectable phenotype (brown). x-axis depicts 1000 bp upstream of the transcriptional start site (TSS), the length of the gene bodies in percentage, the transcriptional end site (TES) and 1000 bp downstream. (See Figure S7 for further ChIP results and phenotypic characterization of Set1 loss-of-function)
(H) Pol II ChIP from FACS purified GSCs showing an increased association of Pol II at genes with a phenotype (green) in our screen over genes without a detectable phenotype (brown). x-axis depicts 1000 bp upstream of the transcriptional start site (TSS), the length of the gene bodies in percentage, the transcriptional end site (TES) and 1000 bp downstream.
(I–J) Larval brains expressing Set1 shRNA, or no RNAi (control) using insc-Gal4≫CD8::GFP stained by neuronal marker Pros (I), or H3K4me3 and DAPI (J). Yellow arrowheads point to Nbs.
Scale bars: 20 μm.

