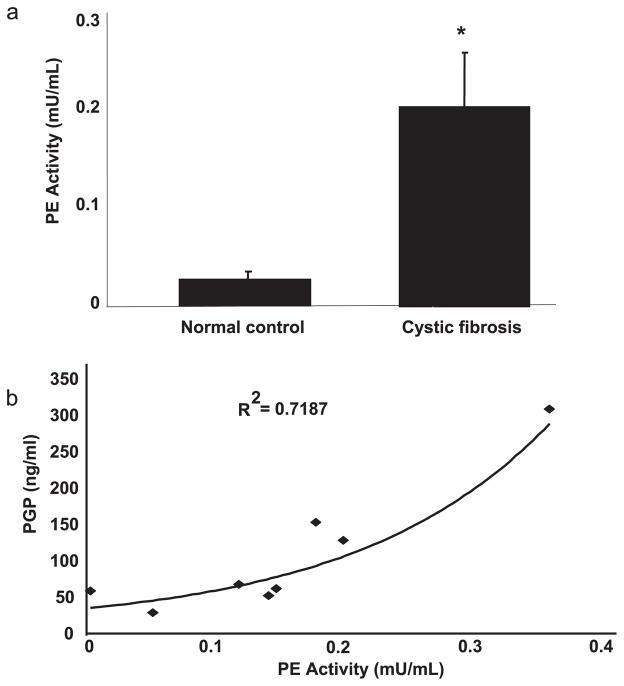
FIGURE 2.
a, PE activity was elevated in CF samples compared with normal controls: CF (n = 10) and normal control (n = 10) sputum samples were examined for PE activity using a colorimetric assay. CF samples demonstrated a 5-fold increase in PE activity compared with normal controls (*, p < 0.01). b, PE activity correlated with PGP: concentration of PGP was correlated with PE activity in CF samples (n = 8). The samples demonstrated a correlation coefficient (R2) of 0.718 (p < 0.01).

