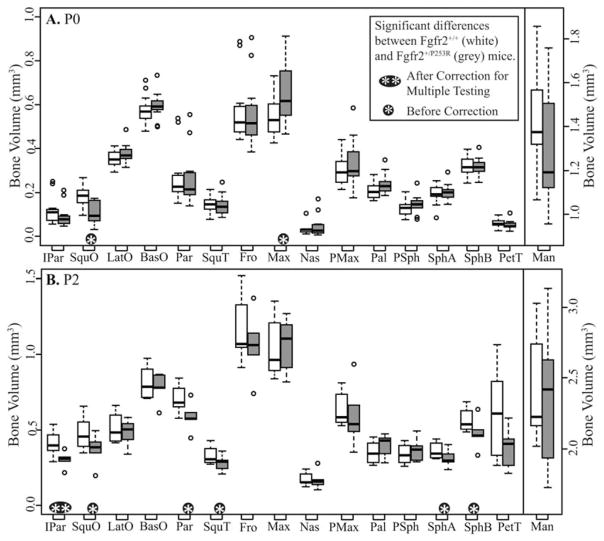
Fig. 4.
Boxplots of bone volumes by age, comparing the bone volume distributions for each bone between both genotypes at (A) postnatal day (P) 0 and (B) P2. White boxes represent Fgfr2+/+ and gray boxes represent Fgfr2+/P253R. Dots represent outlier values that are more than 1.5 times the interquartile range from the box. Bone abbreviations are defined in Fig 2.

