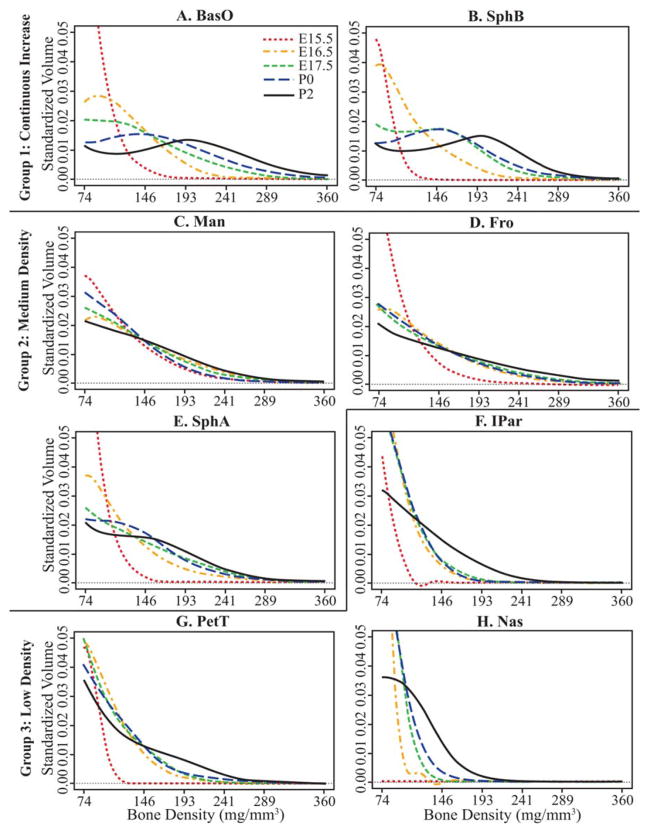
Fig. 5.
A–H: Mean relative bone density curves for a subset of bones of Fgfr2+/+ specimens at each age, representing three patterns of bone maturation. The axis scales are standardized across plots to allow for easy comparison, but forcing high standardized volume values off the plots. Bone density is measured as mg/mm3 partial density of hydroxyapatite. Histogram values are standardized by total bone volume. Images illustrating relative density curves for all bones are available at www.getahead.psu.edu/ApertDenVol for interested readers.

