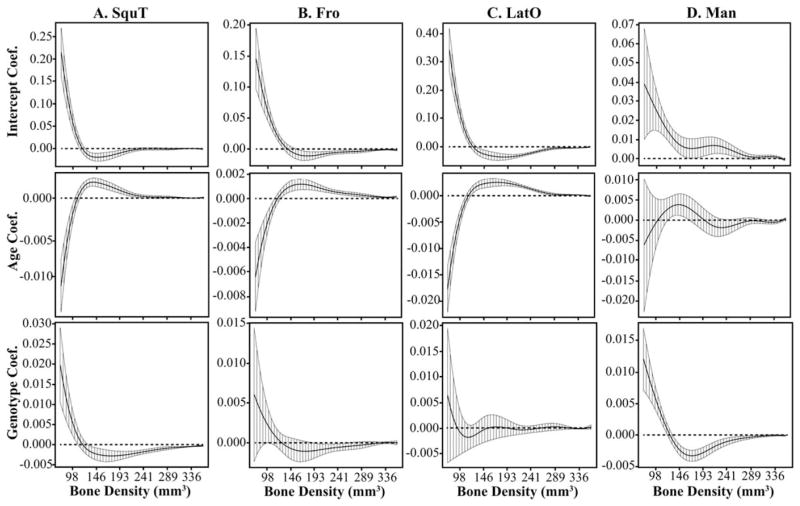
Fig. 6.
The functional intercept, age, and genotype coefficients and 95% confidence intervals from prenatal multivariate regressions of relative bone density curves for four bones. The genotype coefficient illustrates how the Fgfr2+/P253R mice differ from unaffected littermates, independent of age. The y-axis differs for all plots. A: SquT displays a significant genotype effect between E15.5 and P0, which is opposite from the effect of increased age. The (B) Fro and (C) LatO do not display a significant genotype effect prenatally, but they do display a significant age effect over a wide range of density values. D: Man is among a few bones that displays a weakly significant age effect during the prenatal period. However, it displays a strong genotype effect. Bone abbreviations defined in Figure 2.

