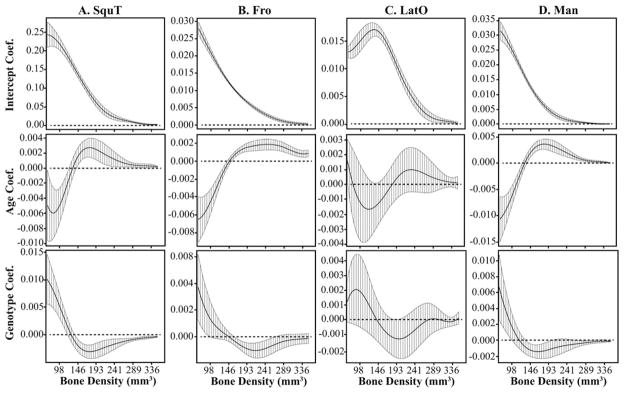
Fig. 7.

The functional intercept, age, and genotype coefficients and 95% confidence intervals from postnatal multivariate regressions of relative bone density curves for four bones. The genotype coefficient illustrates how the Fgfr2+/P253R mice differ from unaffected littermates, independent of age. The y-axis differs for all plots. The (A) SquT and (B) Fro display significant genotype and age effects between P0 and P2, although the genotype coefficient is not significant over a wide range of bone density values. C: LatO does not display a significant genotype or age effect postnatally. D: Man displays a weakly significant effect of genotype and a strong effect of age during the postnatal period. Bone abbreviations defined in Figure 2.
