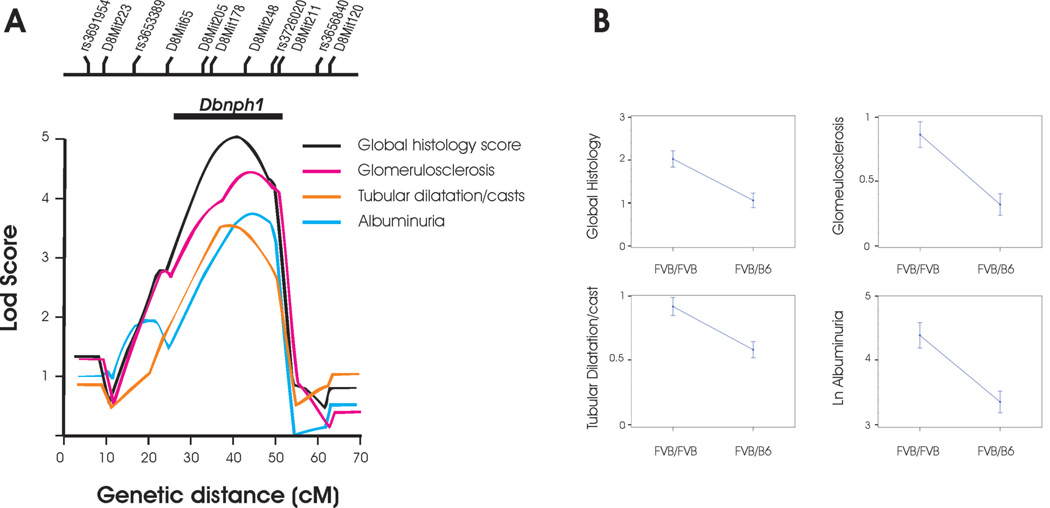
Figure 5. Linkage of nephropathy subphenotypes to chromosome 8.
A. Lod plot demonstrating linkage of all nephropathy subphenotypes to chromosome 8 after fine-mapping with 7 microsatellite markers. The X axis denotes genetic distance in centimorgans (cM). The Y axis shows the lod score. The location of genotyped markers is indicated above the plots. The horizontal line above the lod plots shows the lod −2 interval for the Dbnph1 locus B. Phenotypic values associated with FVB/FVB vs FVB/B6 genotype at the peak lod score (D8Mit248).

