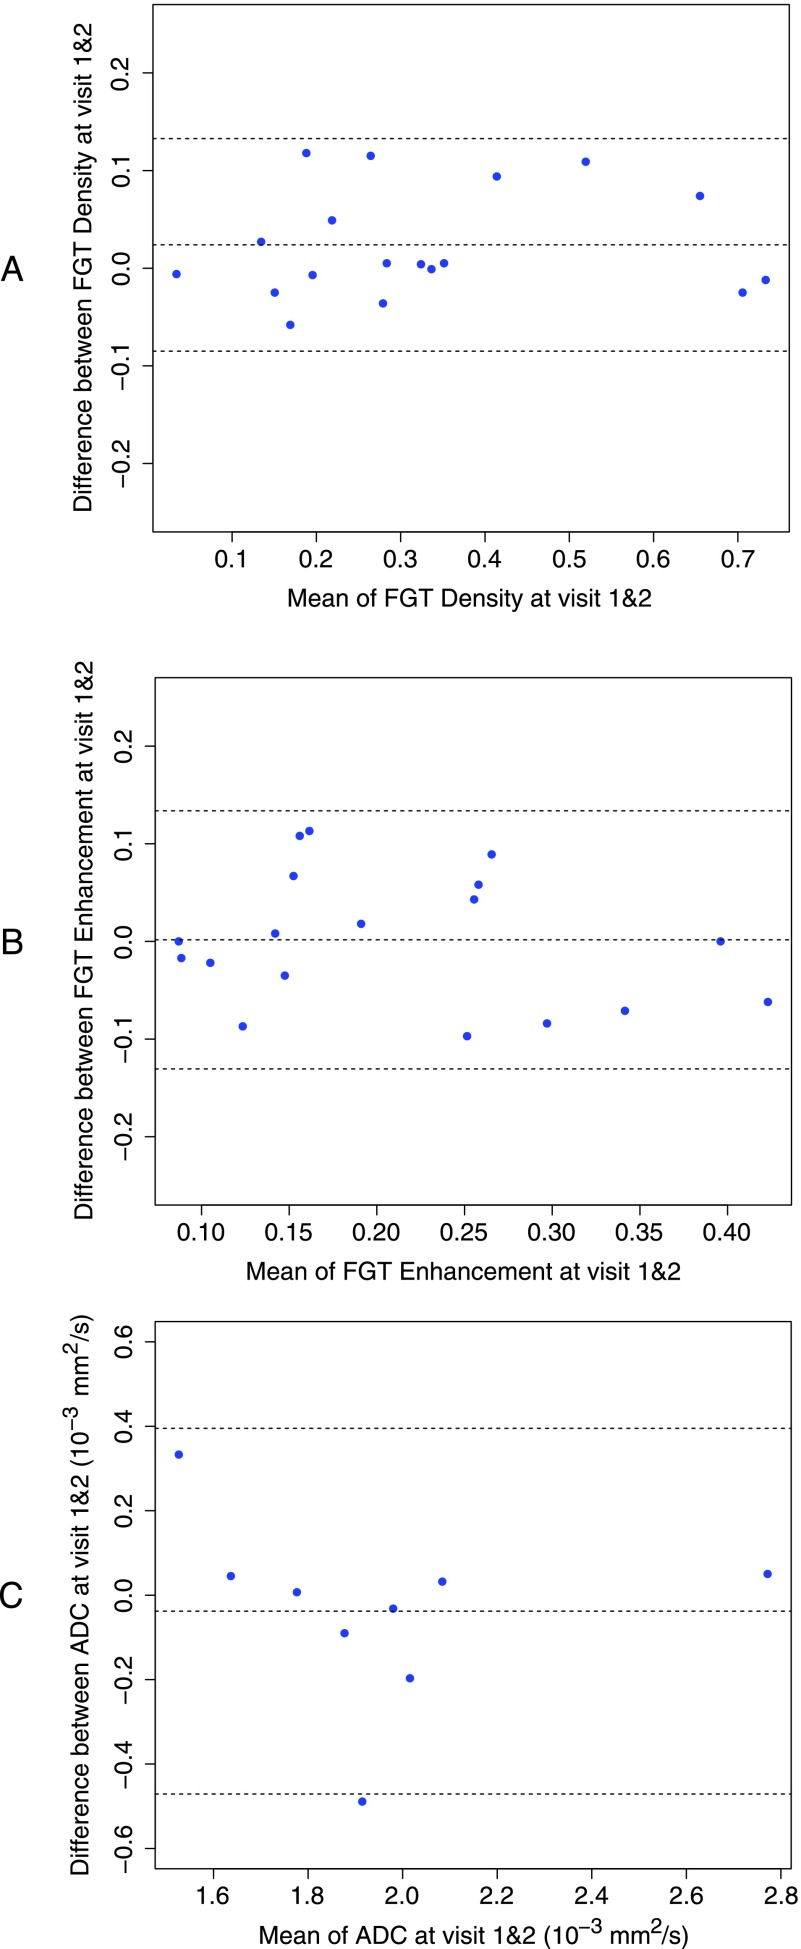
Figure 5.
Bland-Altman plots of difference in measurements from visit 1 to visit 2 versus average of measurements from both visits. Upper and lower dotted lines represent the LOA; the center dotted line is the mean difference. (A) FGT density measurement with a mean difference at 0.024 and LOA (95% CI) of -0.085 (-0.12, -0.046) and 0.13 (0.094, 0.17). (B) FGT enhancement measurements with a mean difference at 0.0016 and LOA (95% CI) of -0.13 (-0.18, -0.084) and 0.13 (0.087, 0.18). (C) ADC measurements (x 10-3) with a mean difference of -0.038 mm2/s and LOA (95% CI) of -0.47 mm2/s (-0.71 mm2/s, -0.23 mm2/s) and 0.4 mm2/s (0.16 mm2/s, 0.63 mm2/s).

