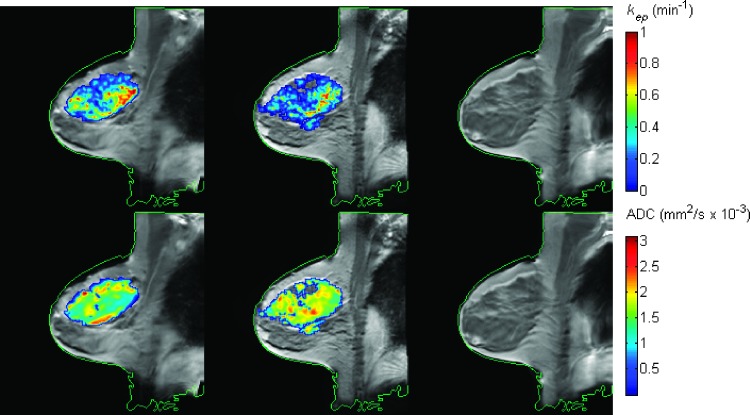
Figure 1.
The kep (top row) and ADC (bottom row) maps superimposed on the postcontrast DCE-MRI data pre-NAC (first column), post-one cycle of NAC (second column), and post-all cycles of NAC (third column) for one patient achieving pCR. Multiparametric maps at different time points were all registered to a common space. The green contour was drawn on the images at t3 and copied to the images at the other time points. The well-aligned contours at all three times indicate the accuracy of the temporal alignment of the images. (The area of nonspecific enhancement seen in the medial quadrant of the breast at t3 was biopsied and found to reveal only benign fibrocystic changes.)

