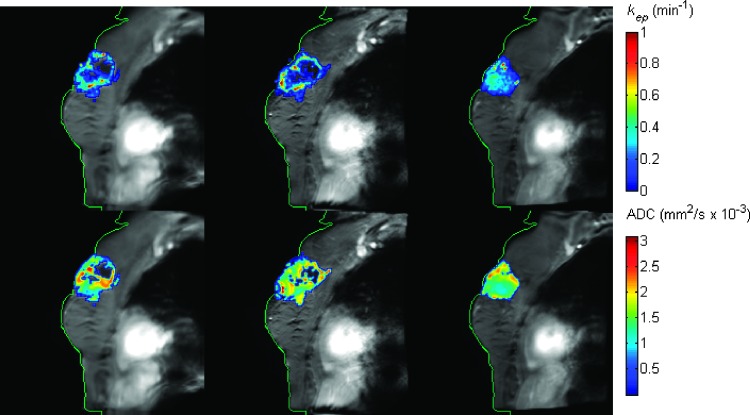
Figure 2.
The kep (top row) and ADC (bottom row) maps superimposed on the postcontrast DCE-MRI data pre-NAC (first column), post-one cycle of NAC (second column), and post-all cycles of NAC (third column) for one non-pCR. Multiparametric maps at different time points were all registered to a common space. The green contour was drawn on the images at t3 and copied to the images at the other time points. The well-aligned contours at all three times indicate the accuracy of the temporal alignment of the images.

