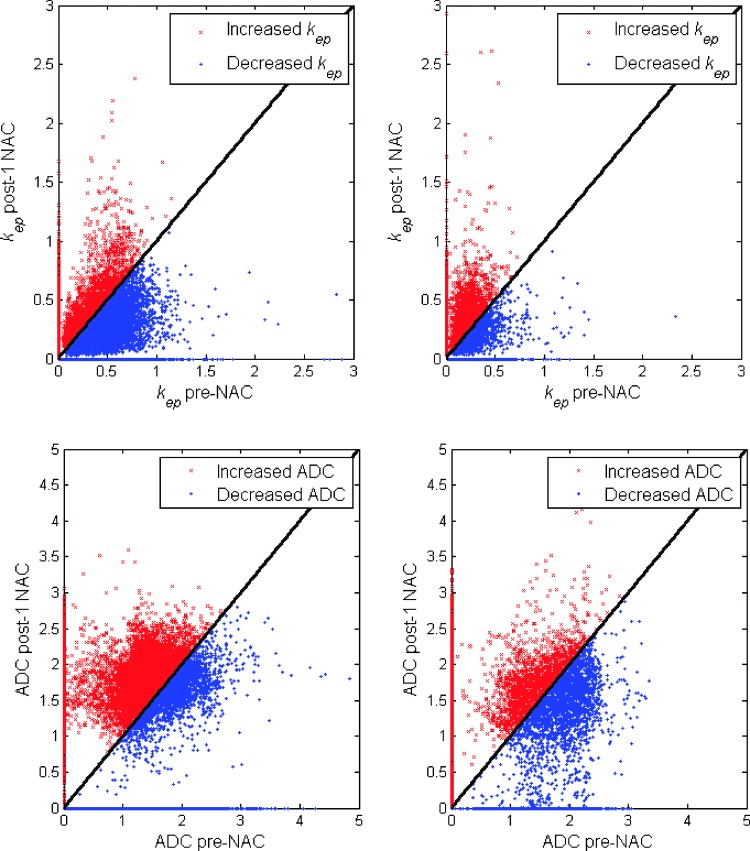
Figure 3.
The kep (top row) and ADC (bottom row) values at the pre-NAC time point were plotted against the kep and ADC values at the post-one cycle of NAC time point for one pCR (left) and one non-pCR (right); red (blue) points indicate those voxels for which there was an increase (decrease) in kep or ADC between the two time points. For the pCR (left), 23.7% of tumor voxels are red, and 76.3% of voxels are blue for kep, whereas 63.0% are red, and 37.0% are blue for ADC. For the non-pCR (right), 49.8% of tumor voxels are red, and 50.2% of voxels are blue for kep, whereas 48.6% of tumor voxels are red, and 51.5% of voxels are blue for ADC, respectively.

