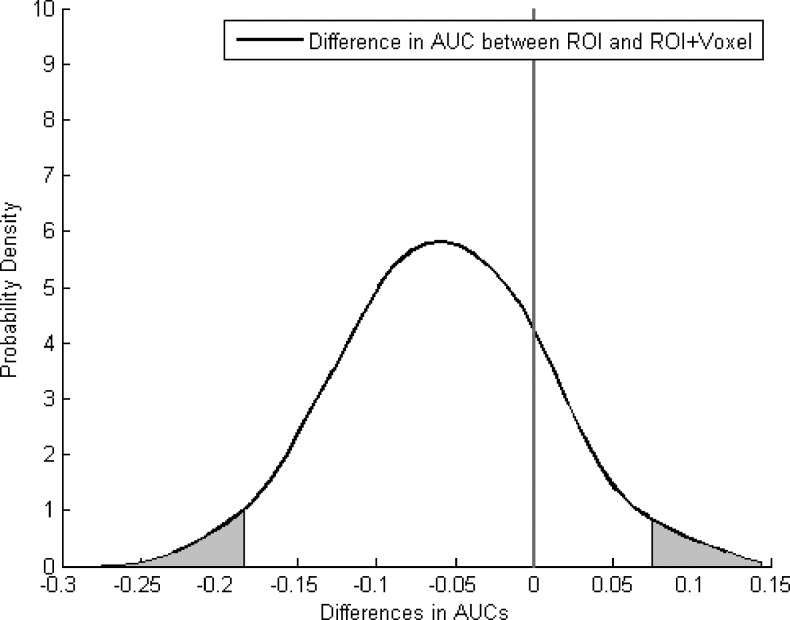
Figure 5.
The figure displays the density distribution of the AUC differences between the ROI analysis and the combined ROI and voxel analysis for the combination of kep and ADC. The areas outside the 95% CIs are shadowed for the distribution. The 95% CIs of the AUC differences were (-0.18–0.075), indicating a moderate trend approaching significance.

