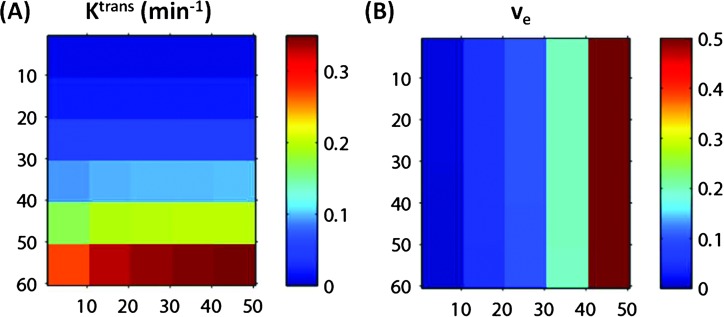
Figure 2.
Two-dimensional image view of the arrays of estimated Ktrans (A) and ve (B) values obtained by fitting the DRO data with the TM algorithm implemented at OHSU. Good agreements are seen between the estimated Ktrans (A) and simulated “true” Ktrans (Figure 1A) values except for in the lower left areas of the panel with high Ktrans and low ve combinations. There are no visible differences seen between the estimated ve (B) and simulated “true” ve (Figure 1B) values.

