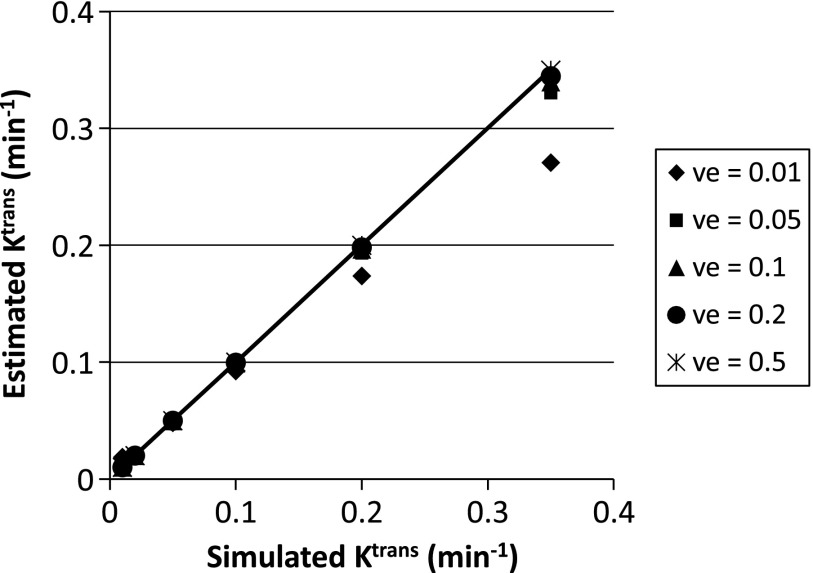
Figure 3.
The estimated Ktrans values obtained by fitting the DRO data with the TM algorithm implemented at ISM are plotted against the simulated “true” Ktrans values at five simulated ve values. The straight line is the line of unity, representing perfect agreement between the estimated and simulated Ktrans values.

