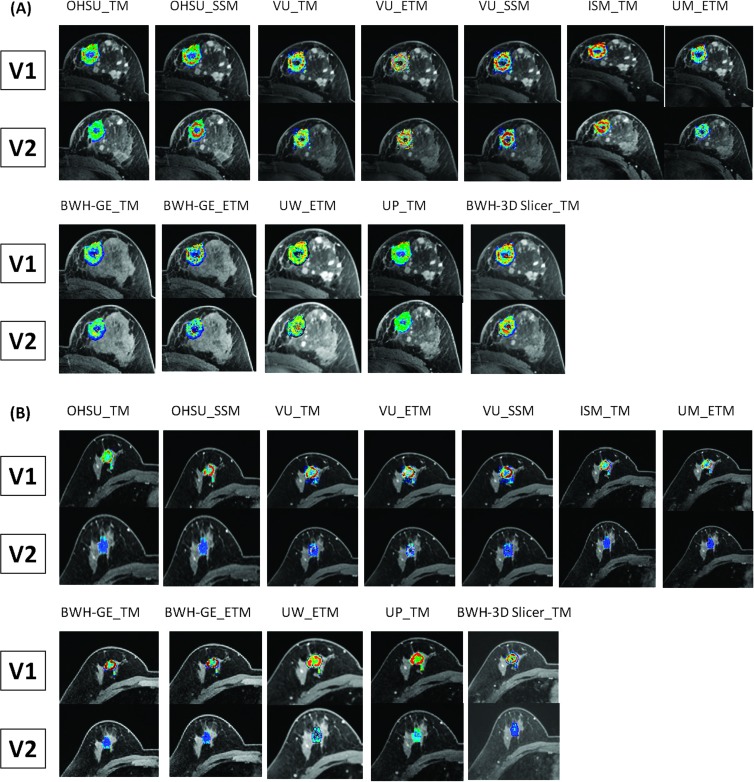
Figure 8.
V1 and V2 single slice tumor Ktrans parametric maps generated by all 12 algorithms for a non-pCR (A) and a pCR (B). The primary tumor was in the left breast of the non-pCR and the right breast of the pCR. The color Ktrans maps are overlaid on post-contrast or pre-contrast DCE images. Although the color scales for these maps are different between subjects and among algorithms, they are kept the same for V1 and V2 maps generated by the same algorithm for the same subject.

