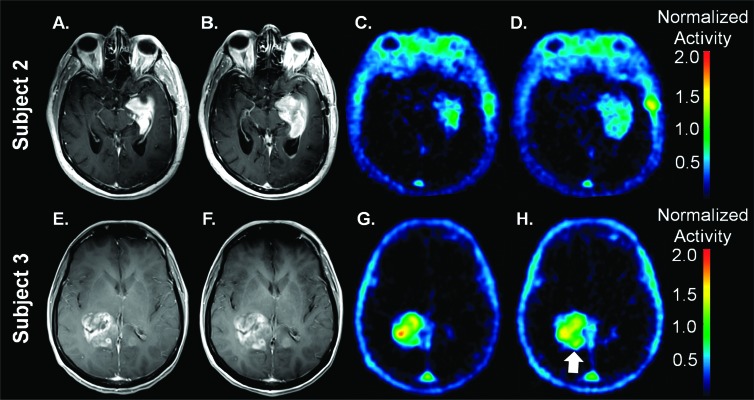
Figure 2.
Representative BL (A and E) and ETA (B and F) contrast-enhanced MRI as well as BL (C and G) and ETA (D and H) F-18 ML-10 PET scans for subject 2 (A–D) and subject 3 (E–H). As described in the text, assessment of response based on qualitative visual interpretation or even by a semiquantitative index is ambiguous. Increased uptake on subject 3 ETA scan at the posterior medial border is indicated with an arrow.

