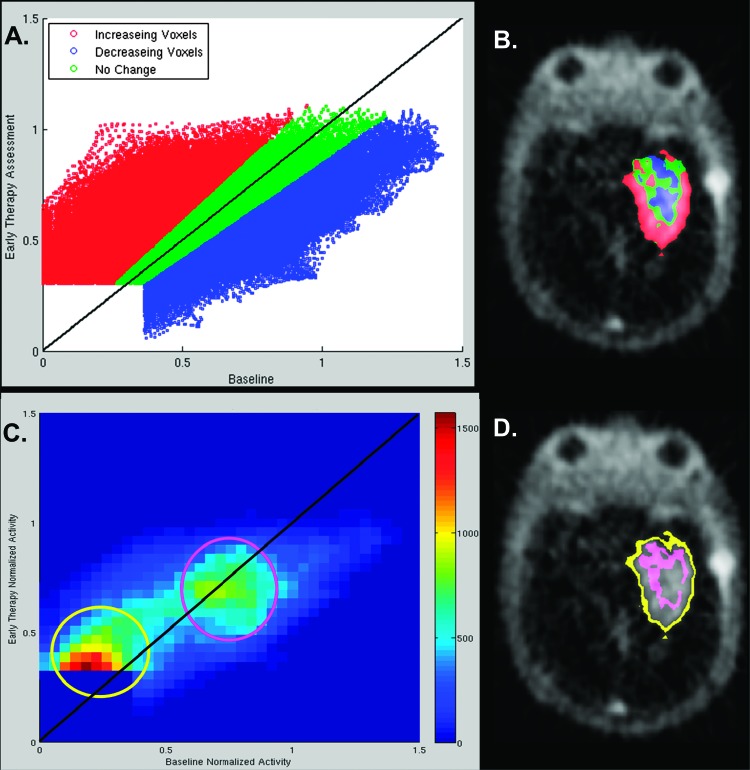
Figure 3.
Voxel change maps for subject 2. A shows a voxel-by-voxel scatterplot of ETA versus BL activity, color coded to indicate voxels that decreased by more than 15% (blue), increased by greater than 15% (red), or neither increased nor decreased by 15% (i.e., unchanged; green). Plate (B) is a representative transaxial slice through the subject's tumor as seen on the ETA PET scan. The colors correspond to the change status of voxels between BL and ETA and have the same meaning as in A. The 2D histogram of plate (C) conveys similar information to that of the scatterplot (A). In plate (C), the density of points in the scatterplot is encoded by color. Plate (D) shows the spatial location (pink and yellow voxels) of two features (pink and yellow circles) seen in the 2D histogram of plate (C).

