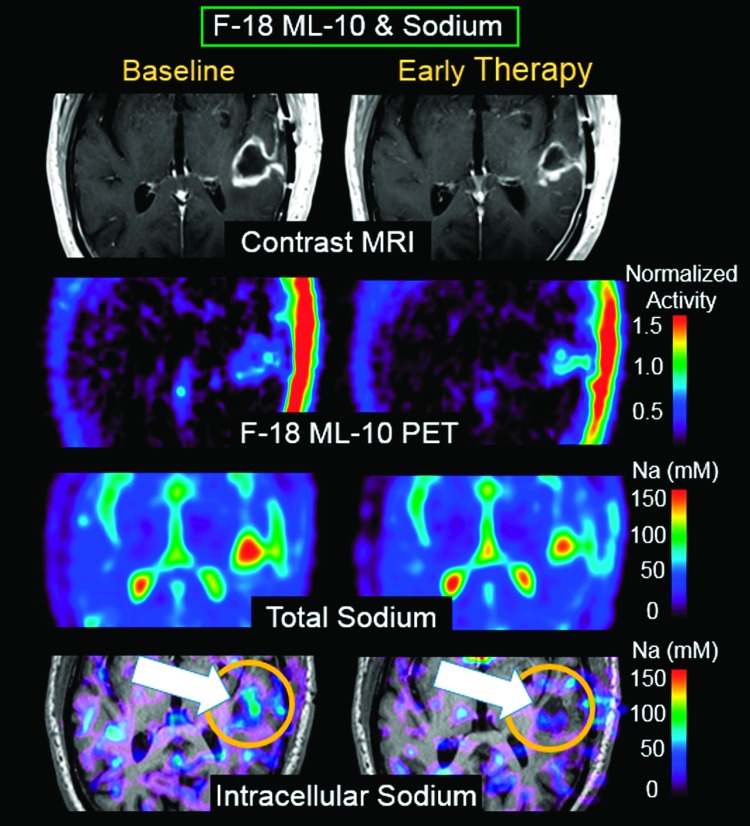
Figure 4.
Same-day F-18 ML-10 PET and sodium MR scans at BL and ETA from subject 4. F-18 ML-10 (apoptosis) is observed to increase at the same location that intracellular sodium (proliferation) decreases (arrow). These results are interpreted as showing decreased proliferation at the same brain location as increased apoptosis.

