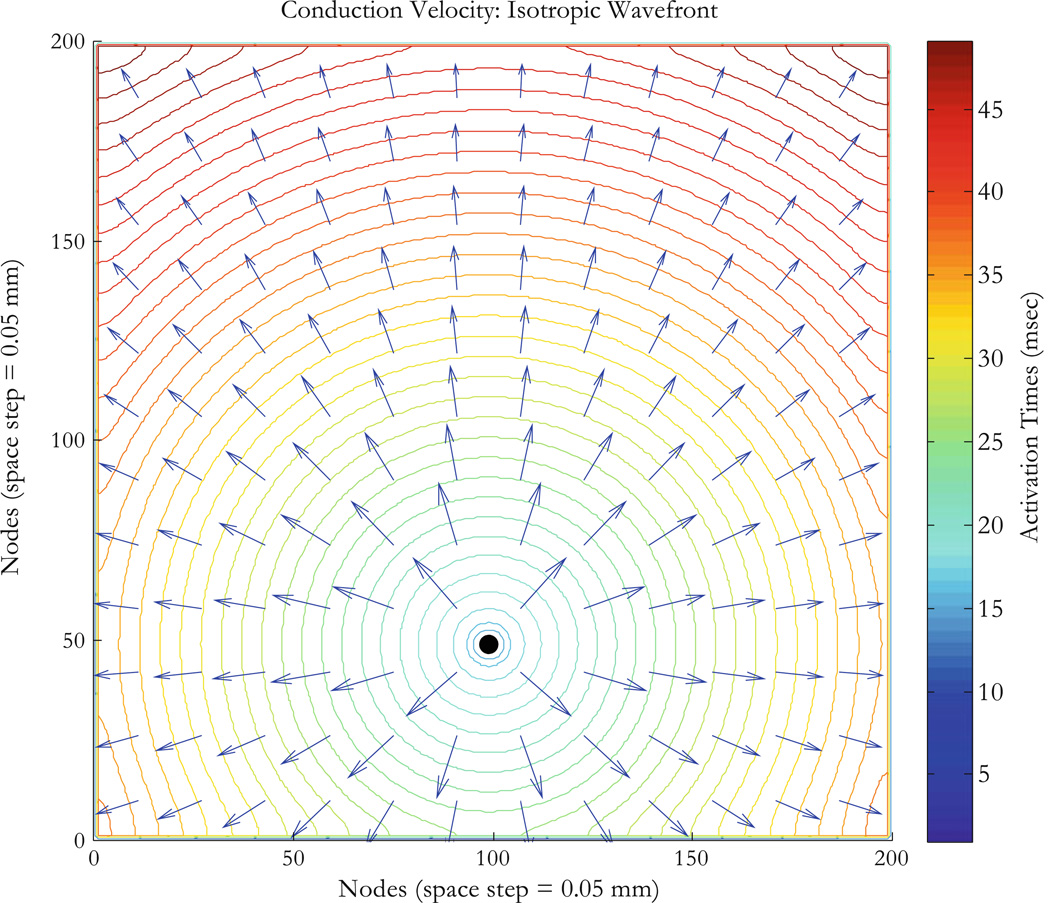
Figure 3.
Isotropic tissue with unipolar stimulus. The arrival time contours and conduction velocity vectors (Eqs. 9 and 10) are for isotropic conductivities with a unipolar stimulus originating at node (100,50) represented by the black dot at the center of the circular wave fronts. The tissue sheet is 10 × 10 mm2 (200 × 200 nodes with 0.05 mm for space step). Activation times for nodes on wavefronts (ms) are shown by the colorbar. The conduction velocity is radial outward from the stimulus site as expected.

