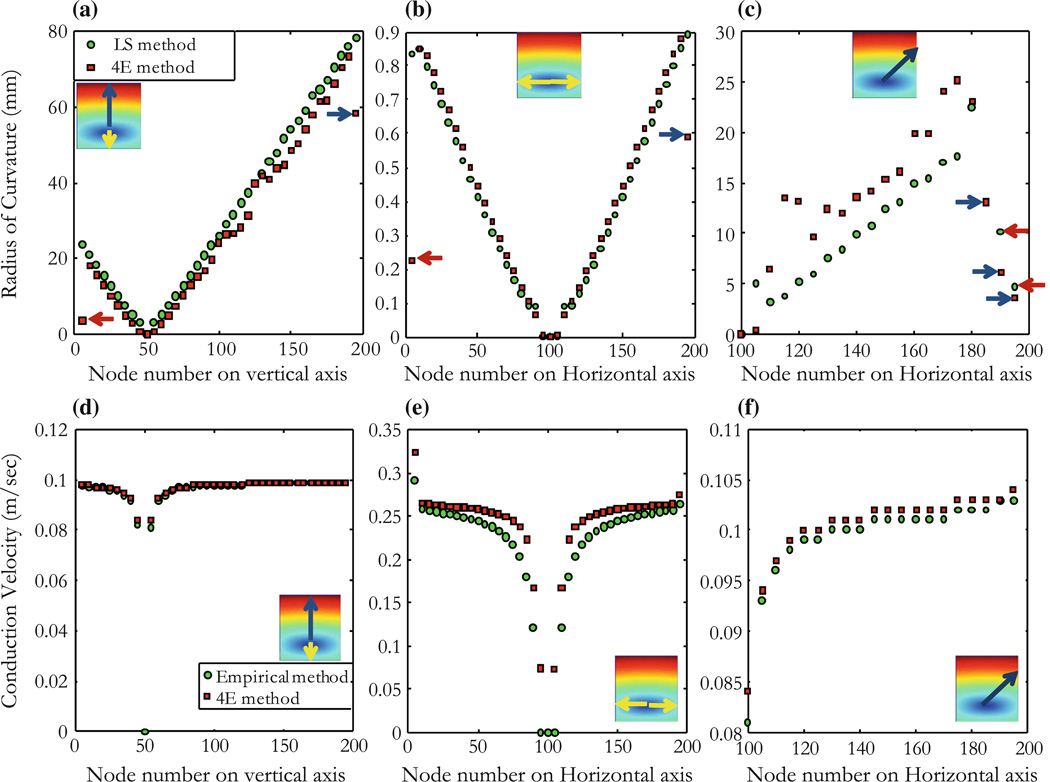
Figure 7.
Anisotropic tissue with a unipolar stimulus. Measurements are made for points along vertical, horizontal, and diagonal (y = 0.7x − 20) lines as shown in insets. The ROC (mm) for the anisotropic tissue is measured using the 4E and the LS methods, described by Eqs. (11) and (15) respectively. (a) Points are on a vertical line (yellow and blue arrows) through the stimulus site (stimulus site is at 50 nodes), (b) points are on a horizontal line (yellow arrows) through stimulus site (stimulus is at 100 nodes), and (c) along a diagonal described by the equations y = 0.7x − 20, x-axis represent the x-components of the points on the diagonal in inset. Blue and red arrows show outliers corresponding to points by the edge of the tissue where the wave front is perturbed. (d, e, and f) Conduction velocity (m/s) for the anisotropic tissue using the empirical method (Eq. 19) and the 4E method (Eq. 9) and for points as described for (a), (b), and (c).

