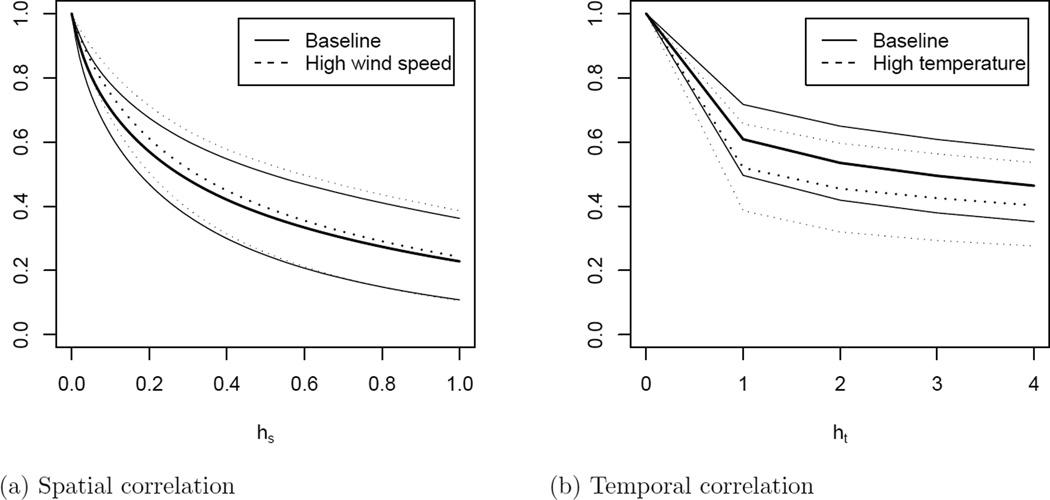
Figure 4.
Posterior mean (thick) and 95% intervals (thin) of the spatiotemporal correlation (4) for various combinations of the covariates. “Baseline” assumes that all covariates are zero (the mean after standardization) for both observations. The other plots assume that all covariates are zero with the exception of one covariate, which equals one standard deviation unit above the mean. The spatial correlation is plotted as a function of spatial distance hs with temporal distance ht = 0, and vice versa.

