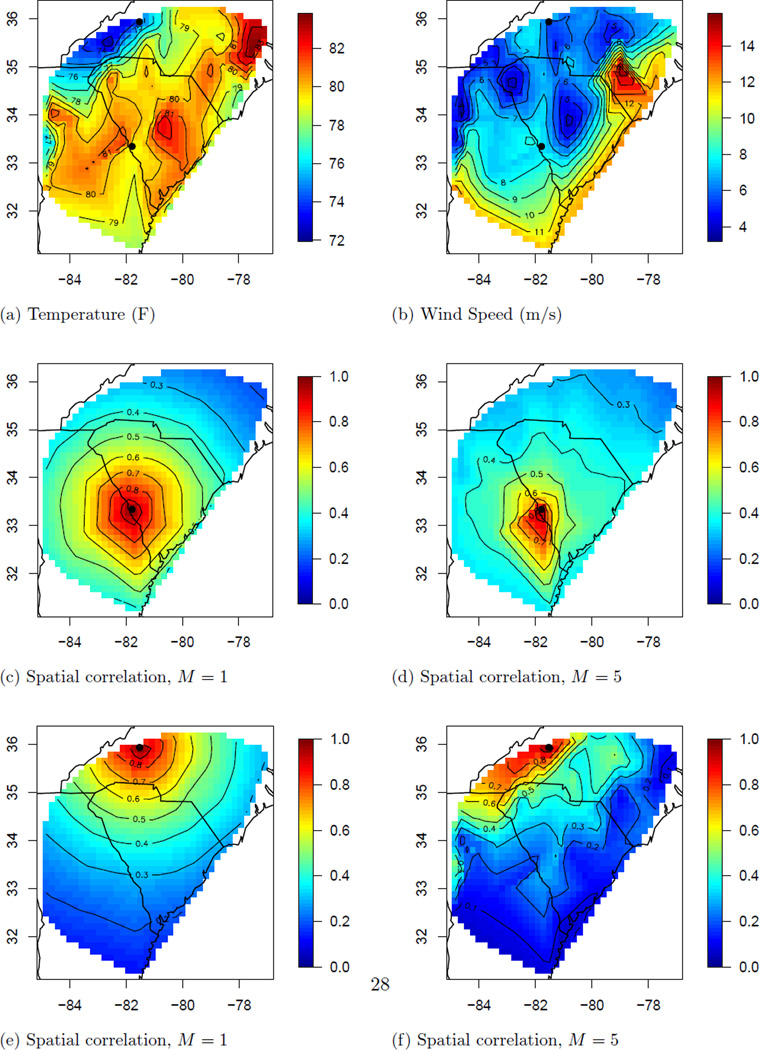
Figure 5.
Data and spatial covariance estimate for August 3, 2005 for stationary (M = 1) and non-stationary (M = 5) models. Panels (a) and (b) plot the observed temperature and wind speed. The remaining panels plot the posterior mean of the correlation between the point marked with a dot and the remaining sites.

