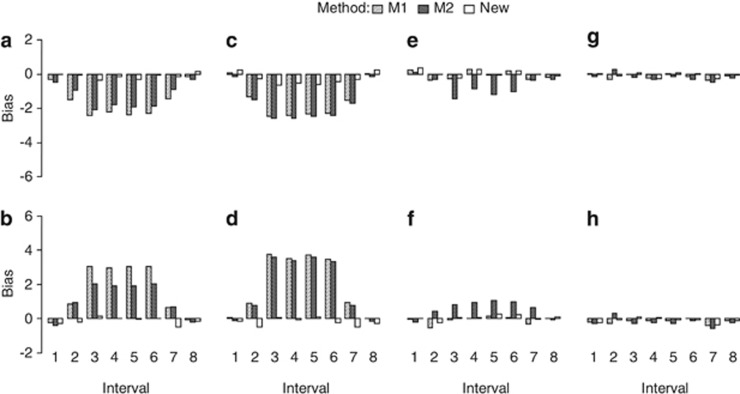
Figure 3.
Effect of SDL genetic mode on the estimate of map distance in a backcross population. The SDL parameters are as follows: (a) a1=a2=i=0.5; (b) a1=−a2=−i=0.5; (c) a1=a2=0,i=0.5; (d) a1=a2=0,i=−0.5; (e) a1=−a2=0,i=0.5; (f) a1=a2=0.5,i=0; (g) a1=−0.5,a2=i=0; and (h) a1=0.5,a2=i=0. The relationship among the parameters in the liability and fitness models is shown in Supplementary Table S3:  and u+v<x+1 (a, c);
  and u+v>x+1 (b, d);
  and u+v=x+1 (e–h);
  and uv<x (a, c, e);
  and uv>x (b, d, f);
  and uv=x (g and h).

