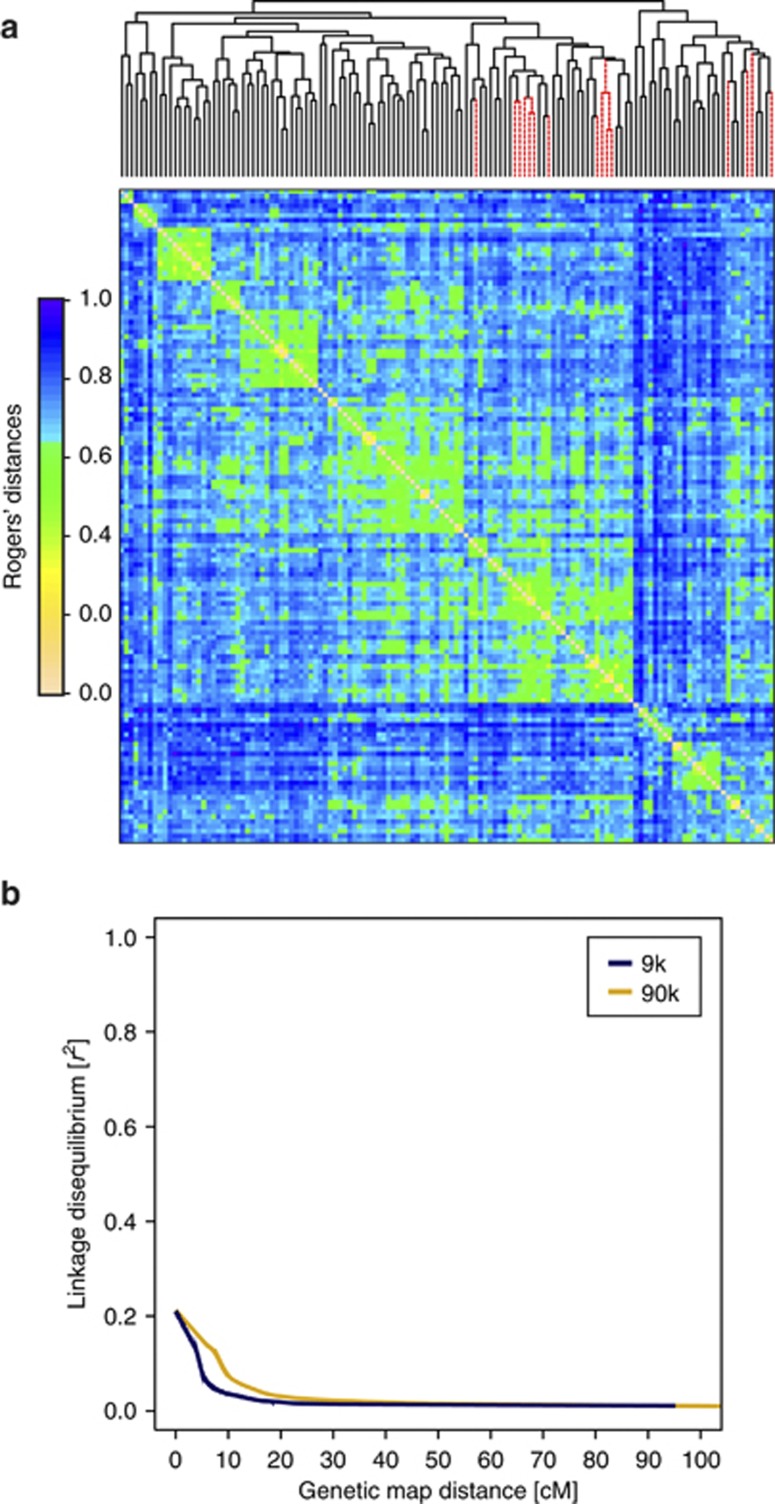
Figure 4.
(a) Pairwise Rogers' distances estimated for the winter wheat inbred lines based on the 90 k SNP array. Average linkage clustering was used for ordering the individual lines. The 15 lines used as male parents are marked as dashed line and the 120 used as female parents as solid lines. (b) Linkage disequilibrium as a function of genetic map distance for analysis based on 9 k SNP array (blue) or 90 k SNP array (red) data. Curves were fitted by robust locally fitted regression. A full color version of this figure is available at the Heredity journal online.

