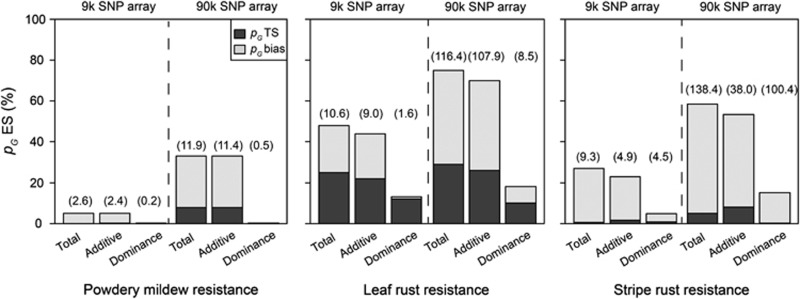
Figure 8.
Average proportion of cross-validated explained genotypic variance in the T0 test sets (pG TS; filled basis of columns) and estimation sets (pG ES; open top of columns) by all QTL (P<0.05 and Bonferroni–Holm correction) detected through genome-wide association mapping for resistance against powdery mildew, leaf rust and stripe rust with a 9 k and a 90 k SNP array. The difference in the explained proportion of genotypic variance between estimation set (pG ES) and test set (pG TS) is denoted as the bias (pG bias). The numbers in brackets indicate the average number of significant marker–trait associations in the estimation set based on 100 cross-validation runs.

