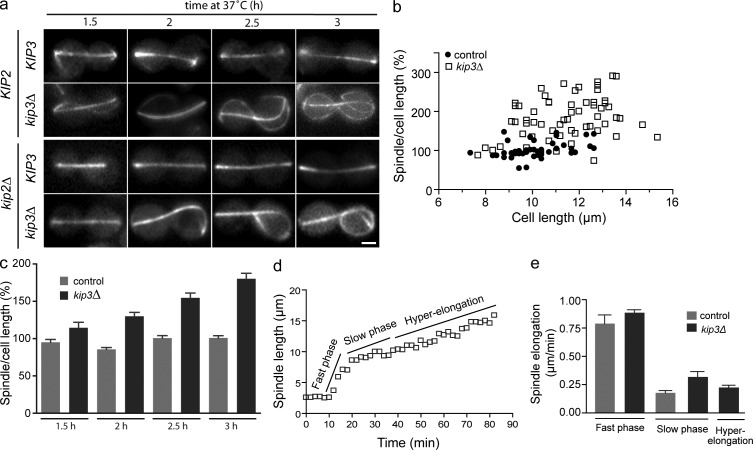
Figure 2.
Kip3 terminates anaphase B elongation when spindle length matches cell length. (a) Images in each row are representative of KIP2 cells ± Kip3 (top) or kip2Δ cells ± Kip3 (bottom). Cells were arrested in anaphase (cdc15-2, 37°C) for the times indicated. (b) In kip3Δ cells, proper scaling of anaphase spindle length to cell size is lost (cdc15-2, 3 h at 37°C). The graph represents the data from two independent cultures, n > 45 for each cell type. (c) Spindle length as a percentage of cell length during anaphase arrest for the indicated times. Average ± SE, n = 47–109 for each time point. P < 0.05 for kip3Δ versus control at all time points. (d) Spindle length over time in an anaphase-arrested kip3Δ cell. The graph shows a single cell from the data collected in panel e. (e) Average spindle elongation rates during anaphase in the presence and absence of Kip3. Average ± SE, n = 9–17 for each phase over at least three separate days of live imaging. P < 0.05 for slow phase. Bar, 2 µm.

